LETS JOIN KIM'S STOCKWATCH GROUP?
Date : 25 March 2021

Kim's Target Price
The Time To Grow
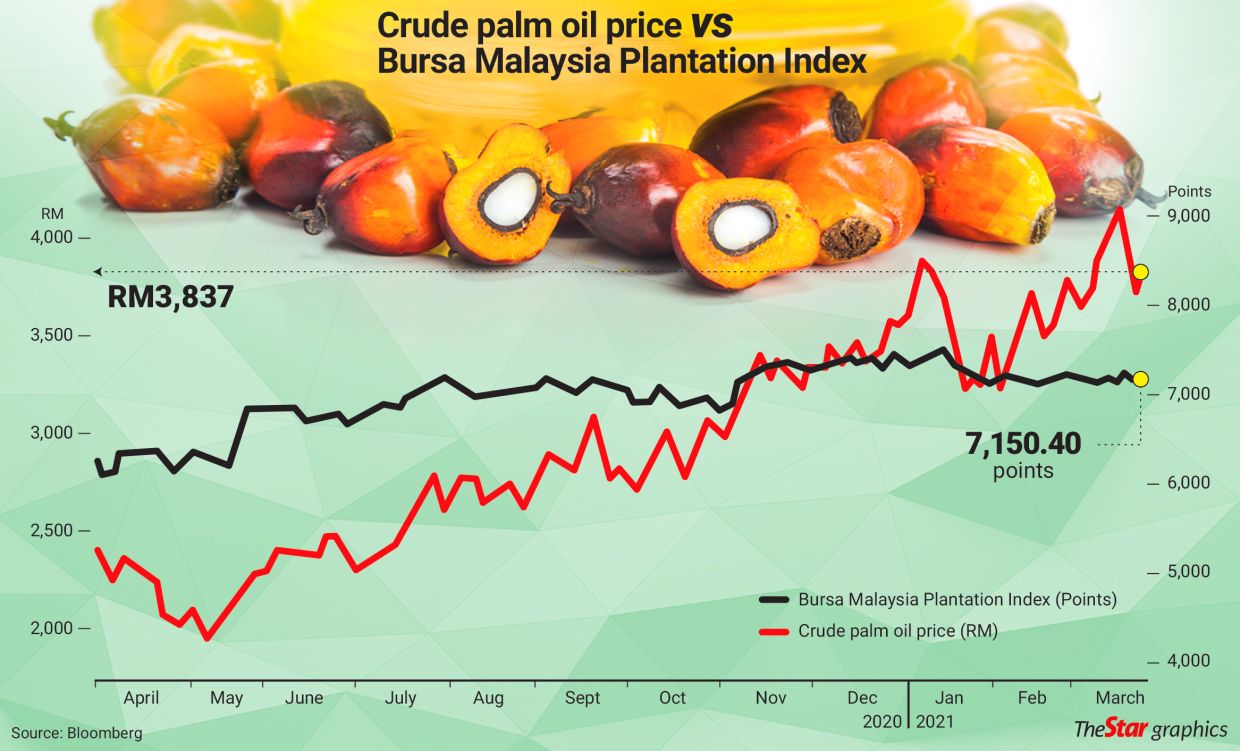
The KeyNote
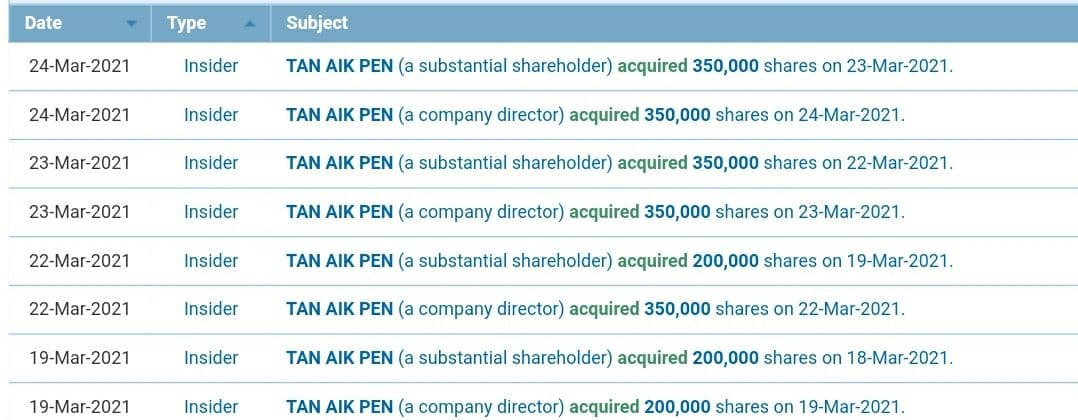
The Director Keep Buying
The Exports of All Palm Products
| PRODUCT | UNIT | JAN – FEB 2021 | JAN – FEB 2020 |
CHANGE (MT/ RM MIL) |
CHANGE (%) |
|---|---|---|---|---|---|
| CPO | Tonnes | 404,715 | 302,665 | 102,050 | 33.72 |
| RM Mil | 1,521.28 | 845 | 677 | 80.11 | |
| PPO | Tonnes | 1,438,380 | 2,000,433 | (562,053) | (28.10) |
| RM Mil | 5,249.85 | 5,860 | (610) | (10.41) | |
| PALM OIL | Tonnes | 1,843,095 | 2,303,098 | (460,003) | (19.97) |
| RM Mil | 6,771.13 | 6,705 | 67 | 0.99 | |
| CPKO | Tonnes | 30,110 | 44,597 | (14,487) | (32.48) |
| RM Mil | 149.92 | 159 | (10) | (5.97) | |
| PPKO | Tonnes | 103,604 | 126,678 | (23,074) | (18.21) |
| RM Mil | 522.97 | 482 | 41 | 8.51 | |
| PALM KERNEL OIL | Tonnes | 133,714 | 171,276 | (37,562) | (21.93) |
| RM Mil | 672.89 | 641 | 31 | 4.91 | |
| PALM KERNEL CAKE | Tonnes | 317,439 | 301,096 | 16,343 | 5.43 |
| RM Mil | 211.61 | 145 | 67 | 46.40 | |
| OLEOCHEMICALS | Tonnes | 500,806 | 498,776 | 2,030 | 0.41 |
| RM Mil | 2,483.62 | 2,001 | 482 | 24.09 | |
| FINISHED PRODUCTS | Tonnes | 96,776 | 82,602 | 14,174 | 17.16 |
| RM Mil | 479.11 | 378 | 101 | 26.80 | |
| BIODIESEL | Tonnes | 38,288 | 80,314 | (42,026) | (52.33) |
| RM Mil | 159.95 | 242 | (82) | (33.79) | |
| OTHERS | Tonnes | 197,677 | 242,236 | (44,559) | (18.39) |
| RM Mil | 271.37 | 221 | 51 | 22.86 | |
| TOTAL | Tonnes | 3,127,794 | 3,679,398 | (551,604) | (14.99) |
| RM Mil | 11,049.68 | 10,332 | 717 | 6.94 |
The Malaysia’s Exports & Imports
| Exports | Imports | |||
|---|---|---|---|---|
| 2021 | 2020 | 2021 | 2020 | |
| Jan | 947,539 | 1,213,569 | 165,198 | 85,033 |
| Feb | 895,556 | 1,089,529 | 87,326 | 66,735 |
| Mar | 1,184,973 | 79,216 | ||
| Apr | 1,236,478 | 56,596 | ||
| May | 1,369,351 | 37,101 | ||
| Jun | 1,706,635 | 48,841 | ||
| Jul | 1,783,284 | 52,691 | ||
| Aug | 1,578,075 | 32,311 | ||
| Sep | 1,612,155 | 48,273 | ||
| Oct | 1,674,380 | 45,398 | ||
| Nov | 1,303,807 | 112,663 | ||
| Dec | 1,642,835 | 282,058 | ||
| Jan-Dec | 17,395,071 | 946,917 | ||
The Exports to Major Countries
| COUNTRY | JAN – FEB 2021 | JAN – FEB 2020 | CHANGE (MT) | CHANGE (%) | JAN – DEC 2020 |
|---|---|---|---|---|---|
| INDIA | 284,404 | 68,006 | 216,398 | 318.20 | 2,726,956 |
| CHINA | 197,599 | 333,635 | (136,036) | (40.77) | 2,730,660 |
| NETHERLANDS | 126,564 | 188,716 | (62,152) | (32.93) | 1,072,952 |
| PHILIPPINES | 88,792 | 130,230 | (41,438) | (31.82) | 693,026 |
| JAPAN | 77,053 | 82,606 | (5,553) | (6.72) | 433,022 |
| IRAN | 72,440 | 7,744 | 64,696 | 835.43 | 321,041 |
| TURKEY | 70,855 | 95,600 | (24,745) | (25.88) | 615,872 |
| U.S.A | 65,579 | 112,382 | (46,803) | (41.65) | 540,349 |
| PAKISTAN | 64,266 | 217,849 | (153,583) | (70.50) | 1,003,723 |
| SAUDI ARABIA | 55,230 | 85,938 | (30,708) | (35.73) | 349,489 |
| TOTAL | 1,102,782 | 1,322,706 | (219,924) | (16.63) | 10,487,090 |
The Production & Stocks
| Production | End-Stocks | |||
|---|---|---|---|---|
| 2021 | 2020 | 2021 | 2020 | |
| Jan | 1,126,457 | 1,171,534 | 1,324,626 | 1,755,417 |
| Feb | 1,105,590 | 1,288,515 | 1,300,808 | 1,700,261 |
| Mar | 1,401,481 | 1,729,592 | ||
| Apr | 1,652,771 | 2,044,498 | ||
| May | 1,651,336 | 2,029,579 | ||
| Jun | 1,885,742 | 1,898,372 | ||
| Jul | 1,807,397 | 1,699,171 | ||
| Aug | 1,863,309 | 1,702,809 | ||
| Sep | 1,869,256 | 1,721,802 | ||
| Oct | 1,724,559 | 1,573,389 | ||
| Nov | 1,491,074 | 1,562,317 | ||
| Dec | 1,333,639 | 1,265,698 | ||
| *Jan-Dec | 1,595,051 | 1,723,575 | ||
| 2021 | 2020 | |
|---|---|---|
| Jan | 3,749 | 3,014 |
| Feb | 3,896 | 2,715 |
| Mar | 2,382 | |
| Apr | 2,299 | |
| May | 2,074 | |
| Jun | 2,412 | |
| Jul | 2,519 | |
| Aug | 2,815 | |
| Sep | 2,924 | |
| Oct | 2,980 | |
| Nov | 3,422 | |
| Dec | 3,621 | |
| *Jan-Dec | 2,765 |
The Malaysian Palm Oil Exports Countries
| COUNTRY | JAN – FEB 2021 | JAN – FEB 2020 | CHANGE (MT) | CHANGE (%) | JAN – DEC 2020 |
|---|---|---|---|---|---|
| AFGHANISTAN | 11,997 | 12,102 | (105) | (0.87) | 75,740 |
| ALBANIA | 19 | 254 | (235) | (92.52) | 1,599 |
| ALGERIA | 3,567 | 5,909 | (2,342) | (39.63) | 17,016 |
| ANGOLA | 13,773 | 13,721 | 52 | 0.38 | 124,017 |
| ANTIGUA | 22 | 0 | 22 | #DIV/0! | 131 |
| ARGENTINA | 427 | 342 | 85 | 24.85 | 2,560 |
| AUSTRALIA | 24,960 | 21,890 | 3,070 | 14.02 | 145,978 |
| BAHRAIN | 1,579 | 2,491 | (912) | (36.61) | 9,758 |
| BANGLADESH | 19,768 | 22,790 | (3,022) | (13.26) | 315,275 |
| BARBADOS | 0 | 45 | (45) | (100.00) | 288 |
| BELGIUM | 1,023 | 473 | 550 | 116.28 | 3,174 |
| BENIN | 7,537 | 16,511 | (8,974) | (54.35) | 111,475 |
| BOSNIA AND HERZEGOVINA | 0 | 24 | (24) | (100.00) | 47 |
| BRAZIL | 768 | 774 | (6) | (0.78) | 9,141 |
| BRUNEI | 1,326 | 1,222 | 104 | 8.51 | 9,092 |
| BULGARIA | 47 | 2,485 | (2,438) | (98.11) | 10,706 |
| CAMBODIA | 124 | 737 | (613) | (83.18) | 2,142 |
| CAMEROON | 2,532 | 2,959 | (427) | (14.43) | 32,117 |
| CANADA | 2,933 | 2,275 | 658 | 28.92 | 12,905 |
| CENTRAL AFRICAN REPUBLIC | 0 | 60 | (60) | (100.00) | 203 |
| CHAD | 0 | 683 | (683) | (100.00) | 1,032 |
| CHILE | 655 | 2,014 | (1,359) | (67.48) | 8,764 |
| CHINA | 197,599 | 333,635 | (136,036) | (40.77) | 2,730,660 |
| COLOMBIA | 42 | 22 | 20 | 90.91 | 639 |
| COMOROS | 139 | 60 | 79 | 131.67 | 1,242 |
| CONGO, DEMOCRATIC REP. OF THE | 15,576 | 4,964 | 10,612 | 213.78 | 47,035 |
| COSTA RICA | 0 | 18 | (18) | (100.00) | 18 |
| COTE D’IVOIRE | 2,926 | 6,716 | (3,790) | (56.43) | 53,799 |
| CROATIA | 758 | 688 | 70 | 10.17 | 7,999 |
| CUBA | 143 | 143 | – | – | 618 |
| DENMARK | 7,241 | 7,695 | (454) | (5.90) | 52,832 |
| DJIBOUTI | 7,252 | 17,909 | (10,657) | (59.51) | 122,390 |
| DOMINICA | 1,787 | 21 | 1,766 | 8,409.52 | 527 |
| DOMINICAN REPUBLIC | 0 | 232 | (232) | (100.00) | 232 |
| EGYPT | 22,266 | 16,924 | 5,342 | 31.56 | 155,747 |
| ERITREA | 850 | 116 | 734 | 632.76 | 2,639 |
| ETHIOPIA | 1,218 | 1,267 | (49) | (3.87) | 20,080 |
| FIJI | 278 | 387 | (109) | (28.17) | 2,443 |
| FRANCE | 67 | 29 | 38 | 131.03 | 259 |
| GABON | 0 | 178 | (178) | (100.00) | 513 |
| GAMBIA | 2,029 | 2,892 | (863) | (29.84) | 19,752 |
| GEORGIA | 2,114 | 7,078 | (4,964) | (70.13) | 19,470 |
| GERMANY | 2,893 | 7,367 | (4,474) | (60.73) | 21,462 |
| GHANA | 29,422 | 32,689 | (3,267) | (9.99) | 246,861 |
| GREECE | 8,705 | 5,733 | 2,972 | 51.84 | 16,006 |
| GUATEMALA | 120 | 360 | (240) | (66.67) | 1,219 |
| GUINEA | 539 | 1,854 | (1,315) | (70.93) | 19,577 |
| GUYANA | 571 | 432 | 139 | 32.18 | 2,738 |
| HAITI | 1,001 | 1,618 | (617) | (38.13) | 12,743 |
| HONG KONG | 5,623 | 596 | 5,027 | 843.46 | 10,541 |
| HUNGARY | 0 | 238 | (238) | (100.00) | 1,451 |
| INDIA | 284,404 | 68,006 | 216,398 | 318.20 | 2,726,956 |
| INDONESIA | 695 | 9,170 | (8,475) | (92.42) | 19,101 |
| IRAN | 72,440 | 7,744 | 64,696 | 835.43 | 321,041 |
| IRAQ | 1,986 | 19,276 | (17,290) | (89.70) | 25,869 |
| ITALY | 25,465 | 61,469 | (36,004) | (58.57) | 439,053 |
| JAMAICA | 238 | 196 | 42 | 21.43 | 1,809 |
| JAPAN | 77,053 | 82,606 | (5,553) | (6.72) | 433,022 |
| JORDAN | 4,697 | 1,958 | 2,739 | 139.89 | 13,136 |
| KAZAKHSTAN | 485 | 3,091 | (2,606) | (84.31) | 16,066 |
| KENYA | 48,571 | 19,542 | 29,029 | 148.55 | 520,758 |
| KIRIBATI | 19 | 20 | (1) | (5.00) | 88 |
| KUWAIT | 5,480 | 6,060 | (580) | (9.57) | 20,449 |
| KYRGYZSTAN | 0 | 86 | (86) | (100.00) | 591 |
| LAOS | 58 | 42 | 16 | 38.10 | 248 |
| LATVIA | 0 | 128 | (128) | (100.00) | 1,794 |
| LEBANON | 1,276 | 1,978 | (702) | (35.49) | 7,675 |
| LIBERIA | 315 | 701 | (386) | (55.06) | 7,749 |
| LIBYA | 75 | 0 | 75 | #DIV/0! | 273 |
| LITHUANIA | 2 | 0 | 2 | #DIV/0! | 97 |
| MACEDONIA | 47 | 139 | (92) | (66.19) | 817 |
| MADAGASCAR | 16,786 | 13,964 | 2,822 | 20.21 | 101,058 |
| MALDIVES | 987 | 892 | 95 | 10.65 | 5,020 |
| MAURITANIA | 7,529 | 8,645 | (1,116) | (12.91) | 88,689 |
| MAURITIUS | 284 | 351 | (67) | (19.09) | 3,281 |
| MAYOTTE | 16 | 0 | 16 | #DIV/0! | 84 |
| MEXICO | 1,120 | 1,108 | 12 | 1.08 | 7,415 |
| MONGOLIA | 165 | 252 | (87) | (34.52) | 1,150 |
| MOROCCO | 376 | 4,306 | (3,930) | (91.27) | 18,613 |
| MOZAMBIQUE | 53,724 | 44,633 | 9,091 | 20.37 | 301,757 |
| MYANMAR | 3,906 | 9,789 | (5,883) | (60.10) | 40,978 |
| NAMIBIA | 45 | 307 | (262) | (85.34) | 972 |
| NEPAL | 573 | 1,013 | (440) | (43.44) | 2,420 |
| NETHERLANDS | 126,564 | 188,716 | (62,152) | (32.93) | 1,072,952 |
| NEW ZEALAND | 4,982 | 6,852 | (1,870) | (27.29) | 31,817 |
| NIGER | 0 | 6,605 | (6,605) | (100.00) | 18,688 |
| NIGERIA | 22,114 | 24,350 | (2,236) | (9.18) | 367,819 |
| NORWAY | 23 | 0 | 23 | #DIV/0! | 44 |
| OMAN | 6,536 | 2,789 | 3,747 | 134.35 | 99,911 |
| PAKISTAN | 64,266 | 217,849 | (153,583) | (70.50) | 1,003,723 |
| PALESTINE | 112 | 0 | 112 | #DIV/0! | 141 |
| PANAMA | 257 | 84 | 173 | 205.95 | 1,244 |
| PAPUA N GUINEA | 3,068 | 793 | 2,275 | 286.89 | 10,551 |
| PARAGUAY | 4 | 0 | 4 | #DIV/0! | #N/A |
| PERU | 0 | 240 | (240) | (100.00) | 675 |
| PHILIPPINES | 88,792 | 130,230 | (41,438) | (31.82) | 693,026 |
| POLAND | 0 | 105 | (105) | (100.00) | 516 |
| PORTUGAL | 13 | 5 | 8 | 160.00 | 328 |
| QATAR | 5,146 | 4,486 | 660 | 14.71 | 20,130 |
| ROMANIA | 661 | 1,337 | (676) | (50.56) | 6,559 |
| RUSSIA | 853 | 1,666 | (813) | (48.80) | 10,967 |
| SAUDI ARABIA | 55,230 | 85,938 | (30,708) | (35.73) | 349,489 |
| SENEGAL | 3,652 | 5,690 | (2,038) | (35.82) | 39,137 |
| SERBIA | 0 | 29 | (29) | (100.00) | 816 |
| SEYCHELLES | 23 | 67 | (44) | (65.67) | 361 |
| SIERRA LEONE | 0 | 1,472 | (1,472) | (100.00) | 4,631 |
| SINGAPORE | 26,942 | 67,441 | (40,499) | (60.05) | 288,240 |
| SOMALIA | 8,851 | 18,525 | (9,674) | (52.22) | 101,595 |
| SOUTH AFRICA | 23,226 | 27,386 | (4,160) | (15.19) | 212,509 |
| SOUTH KOREA | 47,580 | 68,357 | (20,777) | (30.39) | 453,278 |
| SPAIN | 17,821 | 40,098 | (22,277) | (55.56) | 198,287 |
| SRI LANKA | 17,737 | 50,185 | (32,448) | (64.66) | 124,128 |
| ST. LUCIA | 46 | 30 | 16 | 53.33 | 78 |
| SUDAN | 0 | 1,370 | (1,370) | (100.00) | 25,926 |
| SURINAME | 22 | 180 | (158) | (87.78) | 860 |
| SWEDEN | 14,125 | 13,201 | 924 | 7.00 | 103,440 |
| SWITZERLAND | 345 | 43 | 302 | 702.33 | 971 |
| SYRIA | 3,706 | 1,082 | 2,624 | 242.51 | 17,004 |
| TAIWAN | 30,769 | 28,234 | 2,535 | 8.98 | 216,338 |
| TANZANIA | 21,624 | 37,880 | (16,256) | (42.91) | 201,760 |
| TOBAGO | 0 | 21 | (21) | (100.00) | 627 |
| TOGO | 13,788 | 34,873 | (21,085) | (60.46) | 173,758 |
| TRINIDAD | 698 | 1,038 | (340) | (32.76) | 6,167 |
| TUNISIA | 0 | 3,229 | (3,229) | (100.00) | 3,337 |
| TURKEY | 70,855 | 95,600 | (24,745) | (25.88) | 615,872 |
| TURKMENISTAN | 0 | 531 | (531) | (100.00) | 1,358 |
| U.A.E | 13,561 | 11,483 | 2,078 | 18.10 | 102,158 |
| U.S.A | 65,579 | 112,382 | (46,803) | (41.65) | 540,349 |
| UGANDA | 119 | 0 | 119 | #DIV/0! | 1,246 |
| UKRAINE | 2,039 | 17,969 | (15,930) | (88.65) | 49,697 |
| UNITED KINGDOM | 1,157 | 2,844 | (1,687) | (59.32) | 15,505 |
| URUGUAY | 72 | 22 | 50 | 227.27 | 67 |
| UZBEKISTAN | 2,416 | 3,682 | (1,266) | (34.38) | 30,210 |
| VANUATU | 73 | 0 | 73 | #DIV/0! | 156 |
| VENEZUELA | 0 | 23 | (23) | (100.00) | 23 |
| VIETNAM | 37,222 | 49,454 | (12,232) | (24.73) | 436,839 |
| YEMEN ARAB REP. | 24,276 | 4,611 | 19,665 | 426.48 | 94,365 |
| OTHERS | 3,123 | 2,928 | 195 | 6.66 | 23,776 |
| TOTAL | 1,843,095 | 2,303,098 | (460,003) | (19.97) | 17,368,865 |
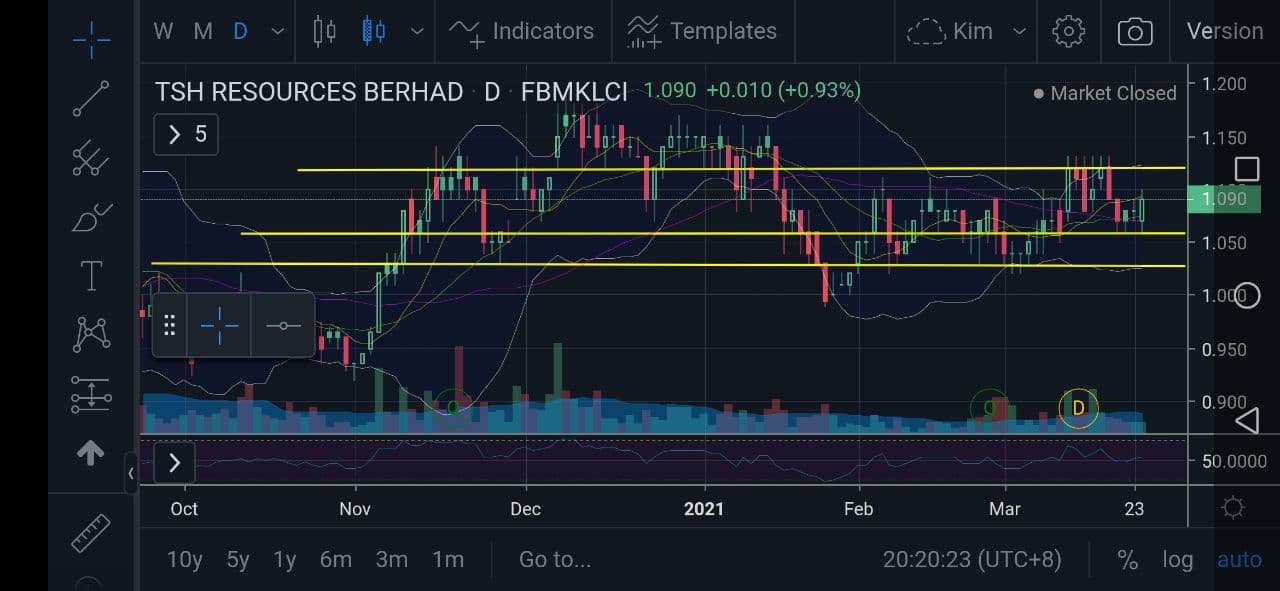
The Chart
The Financial Company
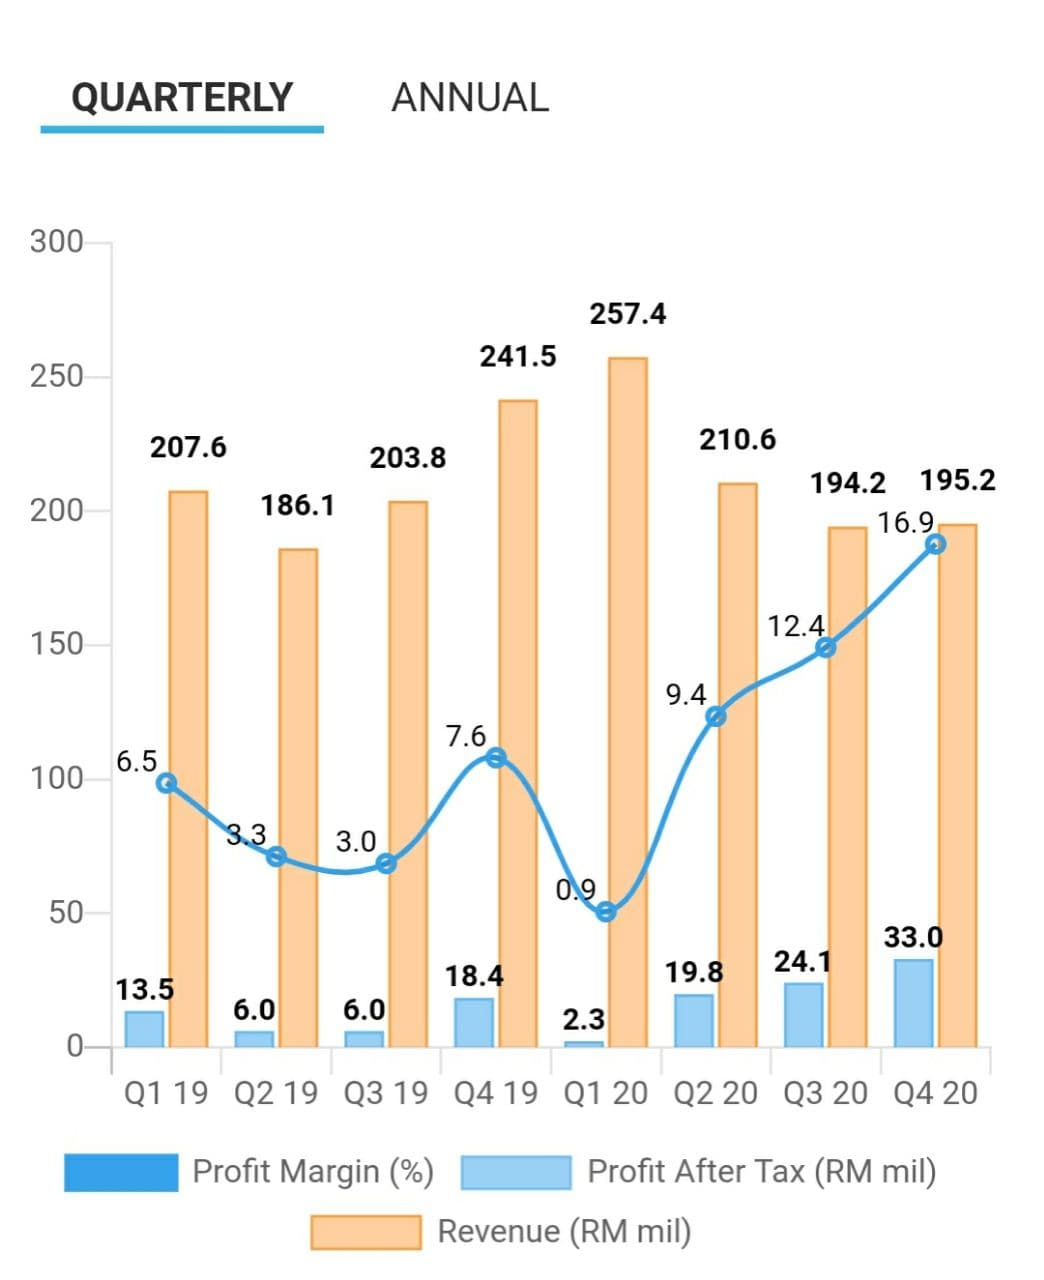 |
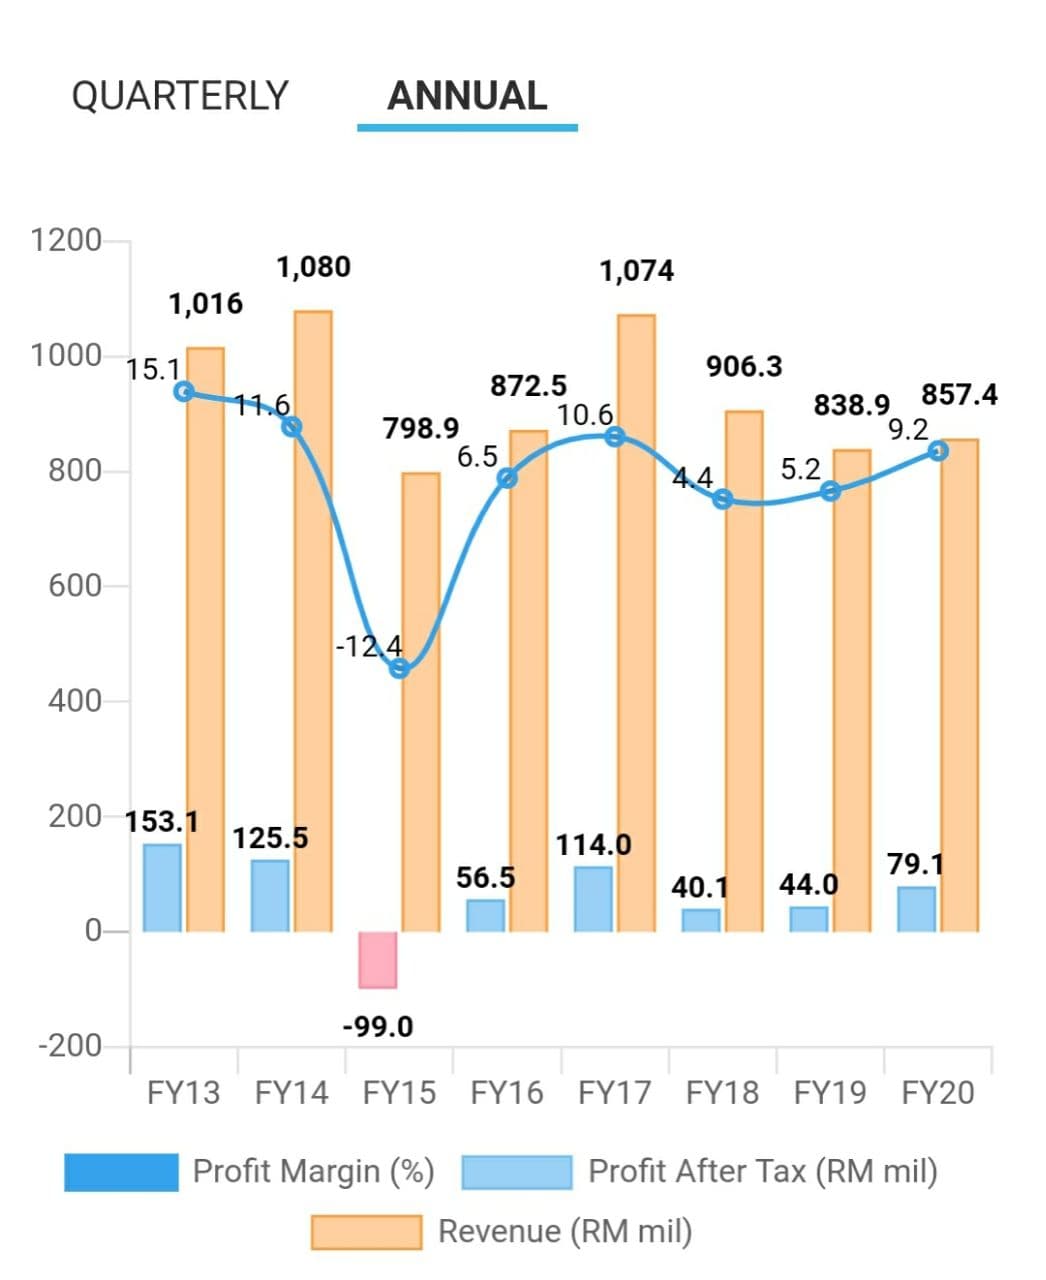 |
The Quater Report & Dividen
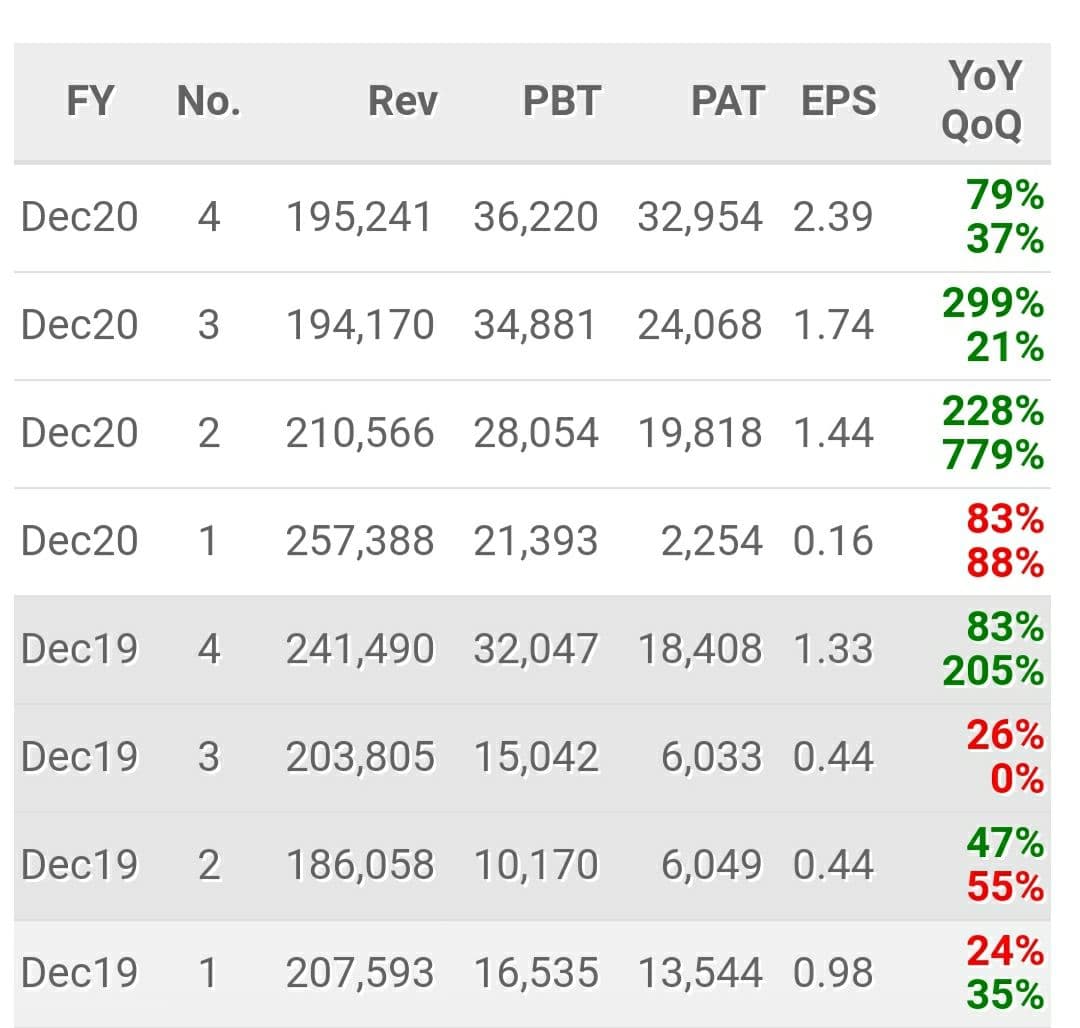 |
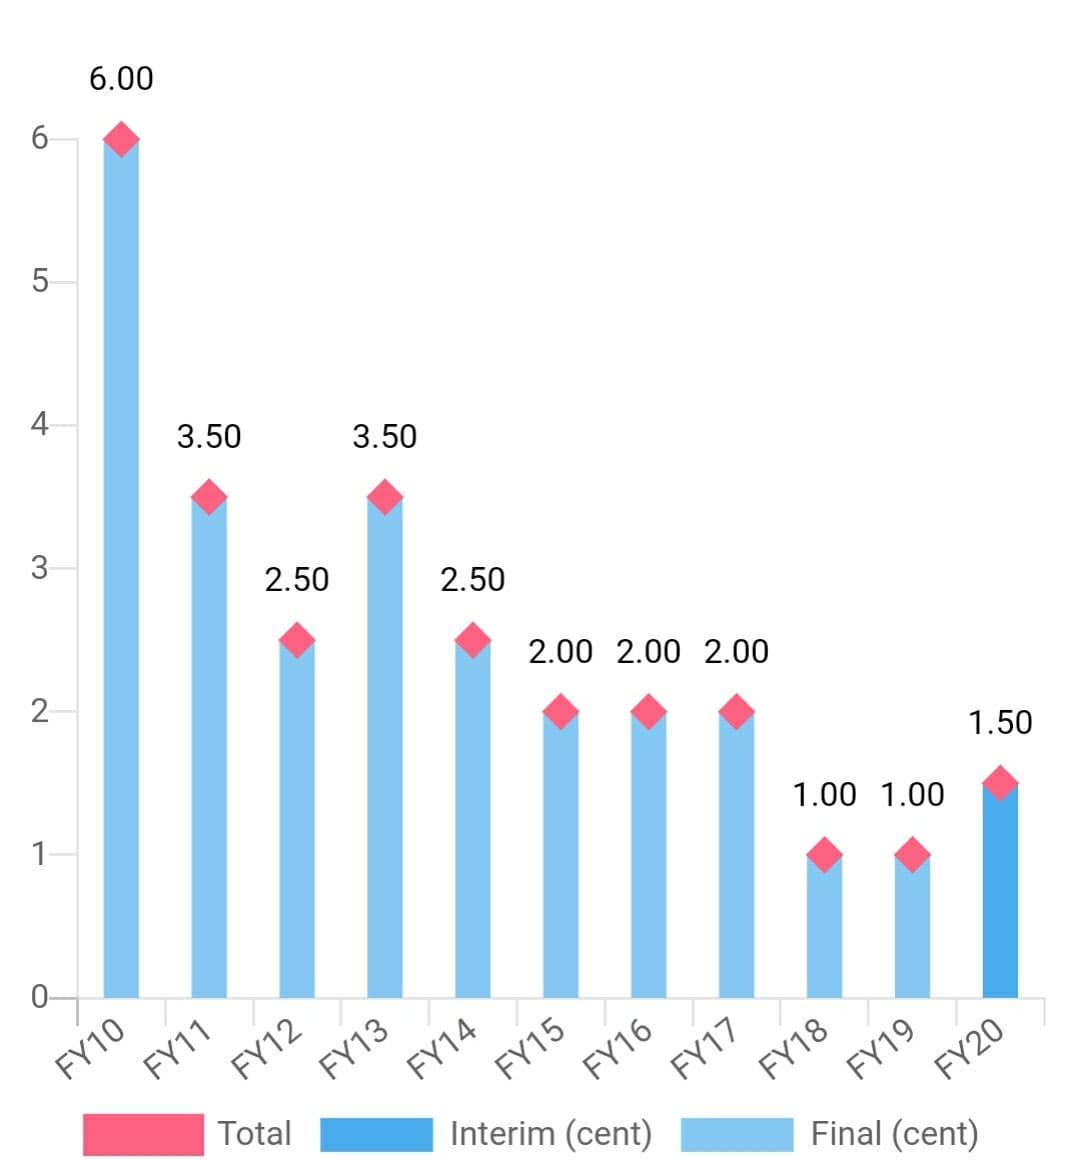 |
Disclaimers: The research, information and financial opinions expressed in this article are purely for information and educational purpose only. We do not make any recommendation for the intention of trading purposes nor is it an advice to trade. Although best efforts are made to ensure that all information is accurate and up to date, occasionally errors and misprints may occur which are unintentional. It would help if you did not rely upon the material and information. We will not be liable for any false, inaccurate, incomplete information and losses or damages suffered from your action. It would be best if you did your own research to make your personal investment decisions wisely or consult your investment advise.
https://klse.i3investor.com/blogs/spartan/2021-03-25-story-h1542983142-MY_LAGGARD_PLANTATION_STOCK_READY_TO_SKYROCKET.jsp
