-->

Type something and hit enter

Pages

Singapore Investment


On

Monday, 9 November 2020

 
Bursa Malaysia - 0012
Bloomberg - TARE:MK
 
Sector : Consumer Product & Service
 
Sub Sector : Food and Beverages
Focus : Sauces and Vinegar
Company Profile:

Three A Resources Berhad, 3A is focused in manufacturing and trading of food and beverage ingredient. The company’s product portfolio include Liquid Caramel, Caramel Colour, Natural Fermented Vinegar, Distilled Vinegar. Rice Vineger, Glucose Syrup, High Maltose Syrup, Soya Protein Sauce, Hydrolyzed Vegetable Protein (HVP) Power, Caramel Powder, Soya Sauce Powder and Maltodextrin.

3A mainly focus in Malaysia (49 %), Singapore (11 %) and Other Countries (40 %). The Group assets and liabilities are mainly located in Malaysia.

Revenue:

Below is the revenue and operating margin of 3A


5 Years Annualise Growth of Revenue

6.97 %

10 Years Annualise Growth of Revenue

9.34 %

 
3A revenue had average growth rate of 6.97 % from 2015 – 2019 which slow down base on 9.34 % growth rate of 9.34 % from 2010 – 2019. In year 2019 3A revenue had slight decrease compare to 2018 revenue, a drop of revenue of RM 1,911,000 which is less than 0 % of the 2018 revenue.

Despite lower revenue, 3A had higher operating margin which is 9.44 % compared to 8.08 % in 2018. 3A able to achieve a better operating margin due to relatively stable raw material costs couple with effective mix and product pricing strategies.

Nett Profit

Bar Chart below shows 3A nett profit from 2010 – 2019.

5 Years Annualise Growth of Nett Profit

10.06 %

10 Years Annualise Growth of Nett Profit

6.36 %


The 30 % drop of Nett Profit in 2018 compared to 2017 was mainly due to increase of raw material price. The raw material in the inventories had increase from Rm 22,907,000 to RM 46,281,000, 202% increase. However in 2019 the price is drop back to RM 27,481,000, 60 % decrease.

Until 30th June 2020, 3A Nett Profit had increase by 12.95 % compared to same period of 2019.

Pro:


  - Raw material price had drop by 60 % compared to 2019.
  - Nett Profit for 2020 is expected to growth at 12.95 %


Assets and Liabilities
 

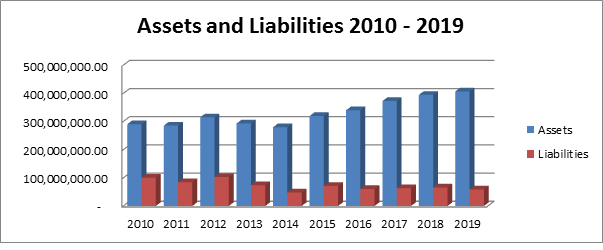
3A asset grows over the period of 2010 to 2019. Besides that it liabilities also reduced over the period.

Trade Receivables

3A had low trade receivable past due for the past 10 year. Highest percentage of trade receivable past due compared to total trade receivable is in 2010 which is around 10%. 3A managed to keep the trade receivable past due low despite increase of trade receivable over the year.
 

Pro:

·      -  Low Trade receivable past due


Financial Ratio


There would be few financial ratios to be look at here:


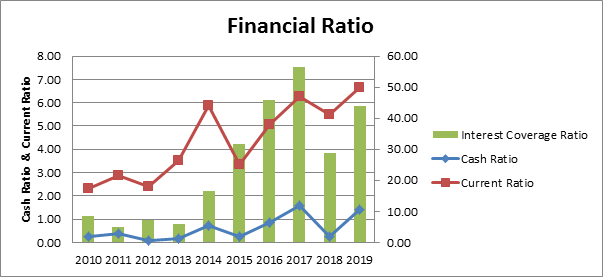
  1. Interest Coverage Ratio (Green Bar Chart)
  2. Cash Ratio (Blue Line Chart)
  3. Current Ratio (Red Line Chart)


 1) Interest Coverage Ratio

Interest coverage ratio measure how capable the company pay off the existing debt. With an interest coverage ratio above one mean the earnings before interest & tax (EBIT) is able to pay of the full amount of the financial cost of the year.

3A manage to keep the interest coverage ratio above one for the past 10 years. In 2019 3A interest coverage ratio is at 48.
 
2) Cash Ratio
 
As cash is the most liquid assets of the company, cash ratio is use to determine company ability to pay off short term liabilities using cash. Cash ratio above one indicates that company able to settle all current liabilities using available cash.
 
3A had low cash ratio which only manage to get above one for 2 years in the last 10 years which is 2017 and 2019.
 
3) Current Ratio
 
Current ratio measures ability of the company to pay off short term obligation (current liabilities). Current ratio above one means the company able to pay off the current liabilities with current asset.
 
Despite low cash ratio, 3A having high current ratio which means 3A consist higher current asset than current liability. In 2019 55 % of the current asset are trade receivable and 3A had low trade receivable past due (0.47 % in 2019) hence 3A had no problem to pay off it current liability.
 

Pro:

·       - 3A having high interest coverage ratio (48) and high current ratio (6.67) for the year 2019


Turnover in Days
 
Let look into three types of turn over as follow:
 
  1. Inventory Turnover (Blue Line)
  2. Trade Receivables Turnover (Red Line)
  3. Trade Payable Turnover (Green Line)


        1) Days Sales of Inventory
        
        10 Years Days Sales of Inventory Median (days) – 75.20
 
On average 3A Days Sales of Inventory is around the median 75.2 days except in year 2014 (421.15) and 2015 (377.21)
 
2) Trade Receivable Turnover (Days)
 
10 Years Trade Receivable Turnover (Days) – 82.50
 
On average 3A trade receivable turnover is 82.50 days.
 
3) Trade Payable Turnover (Days)
 
10 Years Trade Payable Turnover (Days) – 12.39
 
3A had  low trade payable turnover which means it pay it debtor 6.65 times faster than collect back from creditors. Except in 2015 3A had negative trade payable turnover which mean 3A was buying less stock because it has high stock pile in 2014 and 2015.
 

Cons:

·       3A have to pay bad it debtor 6.65 times faster than collect back from creditor


Per Share Analysis


  1.     .  Earnings per share (sen) (Blue Bar)
  2.        Dividend per share (sen) (Red Bar)
  3.        Net total assets per share (Green Line)


1) Earnings per share
 
3A Earning per share is following 16 % trend line for the past 10 years except in 2013 (-36 %) and 2016 (70%).
 
2) Dividends per share
 
3A dividend had growth every two years 1.2 sen for (2012&2013), 1.4 sen for (2014&2015),  1.8 sen for (2016&2017) and 2.0 sen for (2018&2019).
 
Besides that 3A had issue 1 bonus shares for every 4 3A shares on 23 may 2017.
 
3) Net total assets per share
 
3A net total assets per share is following the trend of 14.2 % growth rate for the past 10 year.
 

Pro:

·       - 3A has growing earning per share for the past 10 years

·       - 3A has growing dividend for the past 10 year despite issues bonus shares

·       - 3A has growing net total assets per share for the past 10 years

 
Director’s Remuneration
 
Some company paid high remuneration to director despite low profit. Let see how much is 3A director’s remuneration in comparison to staff fee and operating profit.


The director remuneration maintain at 25 % of the total salaries expense since 2016 which is slightly high. The director remuneration did not decrease despite lower operating profit in 2018 and 2019
 

Cons:

·       - High director remuneration (25 %) of total salaries expenses

·       - Director remuneration did not reduce despite lower operating profit.


ESOS and Warrant
 
No ESOS and Warrant
 
Material Ligation
 
3A had no material ligation as of 3th November 2020.
 
Return on Equity
 
Return of equity can be calculated through Du Point Analysis which uses:
 
  • Net Profit Margin to measure operating efficiency, how much money gets out from its revenue
  • Asset Turn Over to measure asset efficiency, how effective the company make use of its asset
  • Equity Multiplier measure of financial leverage.


5 Years Return on Equity Average
10.56 %
10 Years Return on Equity Average
8.95 %
 
From the chart, 3A return on equity is mainly follow the trend of the profit margin.

Altman Z Score

Companies with Altman Z score < 1.8 is likely headed for bankruptcy while Z score > 3 is unlikely headed for bankruptcy.
 

Convid 19

3A operation is not affect by Movement Control Order by Malaysia Government since 18 March 2020 to fight Convid 19. 3A is classified as essential services. Despite the Convid 19, 3A earning per share for the first 6 months of 2020 had increase by 12.95 % compared to same period last year.
 
Market Research
 
PUBLIC INVESTMENT BANKBHD (25 August 2020)
 
Price Target : RM 0.98
 
  • 2QFY20 revenue down 0.9 % YOY
  • 2QFY20 PBT grew by 14.3% YOY
IVKLS Value
 
1.30
 
http://ivkls.blogspot.com/2020/11/stock-review-3a-0012-three-resources.html


Back to Top