MQ Momentum Trading Strategy (MQMTS)
Momentum investing is a trading strategy in which investors buy securities that are rising and sell them when the momentum has started to exhibit weakness slow down. In such volatile market, momentum trading could be very handy as the goal is to work with volatility by finding buying opportunities in short-term uptrends and then sell when the securities start to lose momentum.
Strength of MQ Momentum Trading Strategy
- Fast response to volume
- Helpful for trades attempting to trade intraday, where MQ Volume Breakout can be screen through MQ Trader "Daily Trading Signals"
Weakness of MQ Momentum Trading Strategy
- Short term trading only
- Any changes of the sentiment in the market or unexpected events shall trigger the change in momentum
How to trade by using MQ Momentum Trading Strategy?
Execution has to be done based on the following conditions strictly:
Entry Strategies:
- MQ Volume Breakout Signal (Green Arrow Appeared)
- RSI goes above 70
- OBV Crossover (blue cross up red)
Exit Strategies:
- RSI goes below 60
- OR OBV crossocer (blue cross down red)
MQMTS on analyzing VIVOCOM
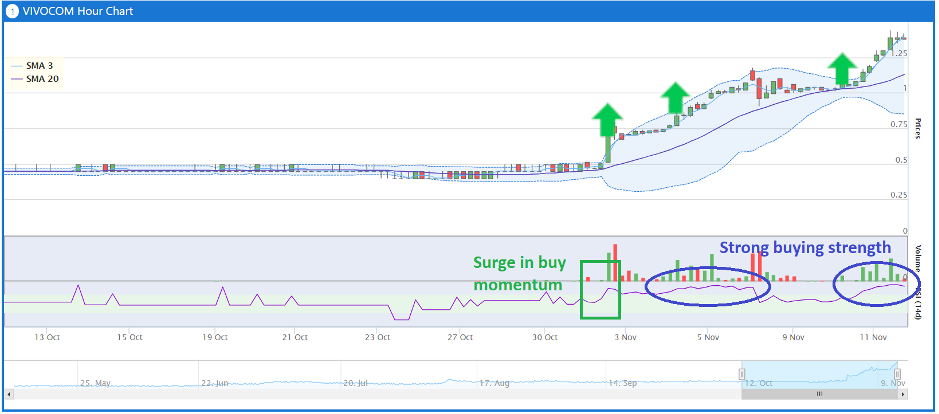
VIVOCOM exhibits a strong buying momentum according to MQ Trader Momentum Strategy


-
MQ Volume Breakout – 3 buy signals are
detected within a short period of time (from 2 Nov – 10 Nov 2020). This
is the sign of the continuous sharp increase of trading volume on
VIVOCOM.
-
RSI – It detected the surge in buy
momentum when there is a steep slope of RSI curve that moved from below
to the top of the “green range”. This indicates that the RSI value is
more than 70% and the share is considered as overbought.
-
RSI curve also stays at the top and
further from the “green range” showing that the buying strength on this
stock is still staying strong now.
-
RSI curve also stays at the top and
further from the “green range” showing that the buying strength on this
stock is still staying strong now.
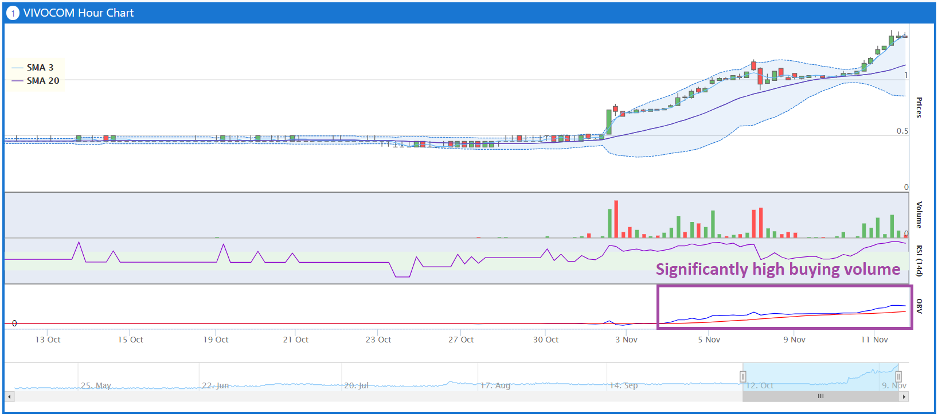
- OBV – OBV indicator displays the crossover of blue line above red line at the same time. Both lines are further away from each other showing that the buy volume is significantly higher than sell volume.
MQ Trader Analysis Tool
Conclusion
MQMTS can be a very powerful tool for short term trading. However, weakness of momentum trading should be taken into consideration when you perform any execution of trading.
Community Feedback
We encourage traders to try out and evaluate the MQ Trader system and provide us feedback on the features you like to see in the system. We have received many positive feedbacks so far, and we are currently compiling and reviewing them for possible inclusion into the next release of the system.
We would like to develop this system based on community feedback to cater for community needs. Thanks to all those who have provided valuable feedback to us. Keep those feedbacks coming in!
Disclaimer
This article does not represent a BUY or SELL recommendation on the stock covered. Traders and Investors are encouraged to do their own analysis on stocks instead of blindly following any Trading calls raised by various parties in the Internet. We may or may not hold position in the stock covered, or initiate new position in the stock within the next 7 days.
Join us now!
MQ Trader stock analysis system uses Artificial Intelligence (AI), various technical indicators and quantitative data to generate accurate trading signals without the interference of human's emotions and bias against any particular stock. It comprises trading strategies which are very popular among fund managers for analysing stocks.
MQ Trader stock analysis system is SPONSORED for MQ Trader members. To use this amazing tool, you can sign up via MQ Trader Sign Up!
Contact us
Please do not hesitate to contact us if you have any enquiry:
