Weekly Time Frame

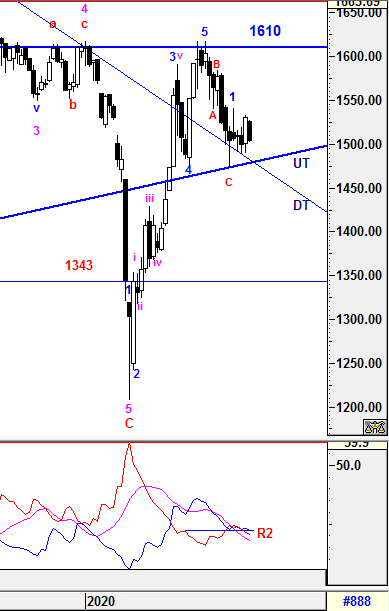
Due to uncertainty sentiment, KLCI had retraced below 1515 again after it was not able to sustain above 1525 and closed within a range of the prior white candle. Current level is still well above 1500 and both DT and UT line are still act as critical support for further consolidation possible. Critical range level to watch would be 1500 & 1530.35, which either levels breach and closed below or above respectively on this coming Friday, could lead to short term continuous trend on the following week.
On other hand, the Higher Degree of Wave counts will be elaborated further in daily time frame.
1) -DMI (red line) continue heading down with lower margin indicates bearish momentum is increasing but still below resistance at point R2 which signalling bear trend is still weakening.
2) +DMI (blue line) reversed donw with greater margin indicates bull strenght is weakening.
3) ADX (pink line)
is still heading down with greater margin which implying the volatility
of the current trend is still very low with uncertainty.
Therefore, the summations of the 3 signals above is implying uncertainty still remains and knee jerk reaction is unavoidable. From current situaton, +DMI is still above -DMI indicate bull strenght in in favor with narrow margin. However, a prominent trend has not been developed yet unless ADX start to curve up where volitility require to initiate stronger momentum.
Prevailing trend could be emerged if levels listed below was broken:
Major Resistance - 1545, 1610
Immediate Resistance - 154
Immediate Support - 1530.35, 1525, 1515, 1500,
Support - 1479 (Revised DT line & UT line - almost same crossed point)
Daily Time Frame

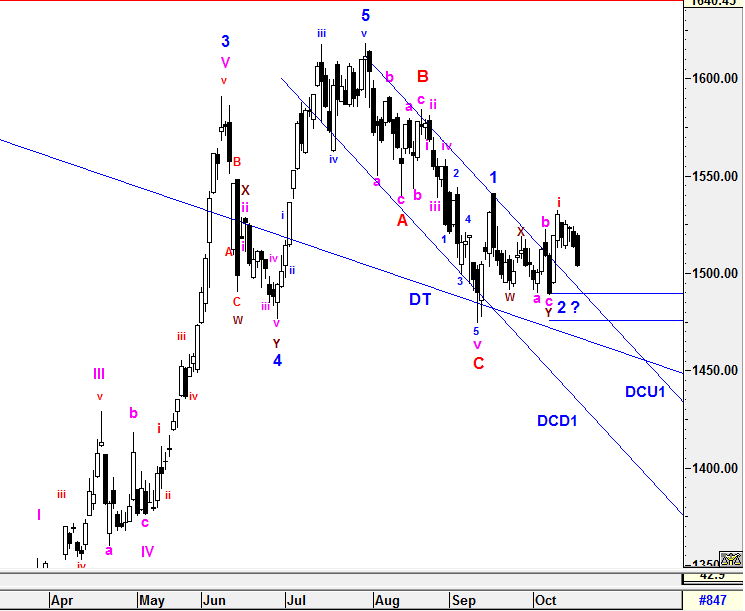
To recap from prior session, wave count confirmation rules are still required for projecting the movement to validate Wave 2 if KLCI manage to breach and close above the end of Wave 1 (1541.14) convincingly. Although 1541.14 has yet to be breached, there was an down trend channel breakout (DC1) incurred on prior week and indicates short term trend has changed to the upside. We may assume that sub minutte waves are being constructed in order to achieve higher level. Currently, sub minutte wave i ended at 1532.53 and sub minutte wave ii with complex correction waves would consist of sub minutte wave a,b,c,x,1,2,3 or 5. Nevertheless, the entire sub minutte wave ii correction has already met the correction level's criteria in between FIBO 61.8 - 76.4%. However, the correction can be taken place beyond FIBO 76.4% without breaching below 1489.56. Besides that, DC1 upper line shall act as support at 1490.
On the other hand, the prior Higher Degree of Correction Waves will be revised If the prior low of wave C (1474.23)
is breached. Therefore, the entire wave structure will still be
monitored closely as complexity wave formations could be emerged such as
WXY correction waves may take place before Higher Degree of 5 Waves Bull Run.
All waves' count and projected target
are generated based on past/current price level and it may be subjected
to vary if degree of momentum movement change.
Prevailing trend could be emerged if levels listed below was broken:
Resistance - 1610
Immediate resistance - 1515, 1525, 1531, 1538
Immediate Support - 1496, 1490 (DCU1 upper line), 1489.56
Support - 1479 (Revised DT line & UT line - almost same crossed point)
==========================================================================
More complex waves may be required for SUPER CYCLE Bull Run? Let's see.
==========================================================================
Let's Mr Market pave the waves.
Trade safely
Wave Believer
https://klse.i3investor.com/blogs/E_Wave/2020-10-18-story-h1534702479-KLCI_waves_29_Is_Wave_2_require_more_complex_waves.jsp
https://klse.i3investor.com/blogs/E_Wave/2020-10-18-story-h1534702479-KLCI_waves_29_Is_Wave_2_require_more_complex_waves.jsp
