QL – one year on, any changes?
On 4 Jan 2019, I posted - QL what is the value?
Now, 25 April 2020, a year plus 3 over months and bored by MCO, I relook at the thesis and here are the findings.
Operation Matrices
One of the important matrices would be staff cost – every ringgit spent on staff brings back how much revenue. Similarly, all things being equal, every ringgit depreciated of plants, properties and equipment (PPE) brings in how much revenue.
And the operating expenses to revenue, is it increasing or reducing.
Here is how they look like: -
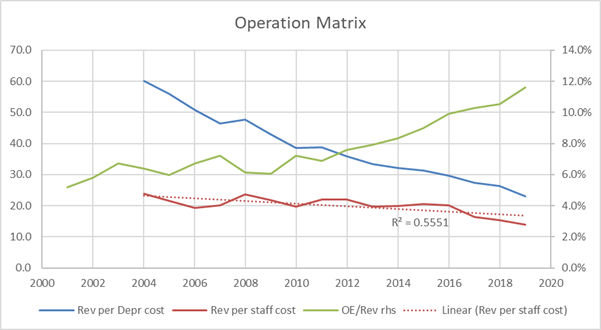
The operating expenses to revenue are unfortunately increasing yearly. Diving into the cost make-up, the two biggest item is depreciation of PPE and staff costs.
Staff productivity is reducing, the trend is downward. Revenue to depreciation is dropping at a higher rate. That is, the more plant, properties and equipment bought is giving less revenue every year.
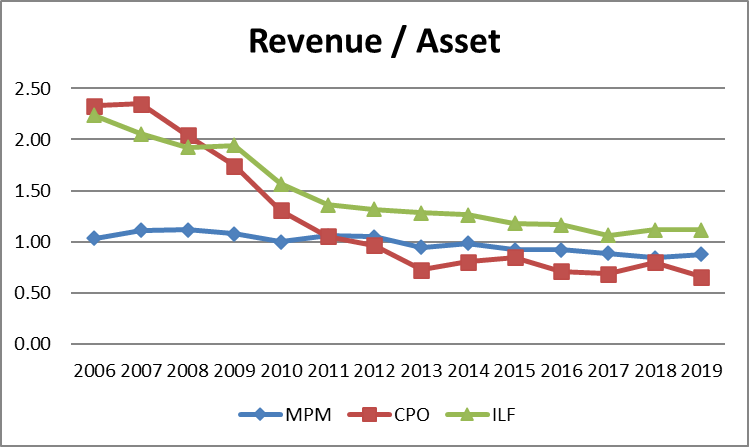
Looking at operating segments of the annual reports, one can obtain the revenue generated from the asset deployed for the various serments.
It does not look good at all. Palm oil is returning less than one ringgit (RM0.65) as well as marine products (0.88) while integrated livestock farming is above one ringgit (1.11).
The general trend of all is creeping DOWN.
Cash flow
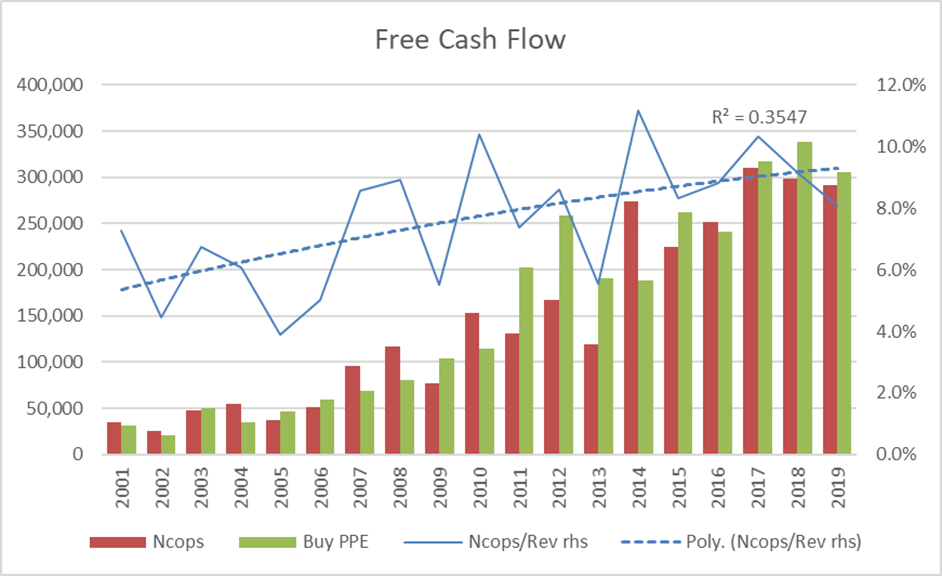
The next important aspect of a company is how much cash is it generating from operation and is it more than its need to purchase PPE, forget about investing in subsidiaries, associates and the likes.
QL does not generate enough cash (from operation) for investing in the necessary PPE. It takes loan and obviously the debt to equity ratio has been creeping up. Also, its ability to generate cash from operation is rather erratic (the blue line).
With all the above added together, the indication is that while gross margin is improving, the ever-lower staff productivity, low return of PPE plus increasing financing cost from higher debts all cut into the net margin that is now approaching 6%.
The trend is, net margin will reduce further going forward.
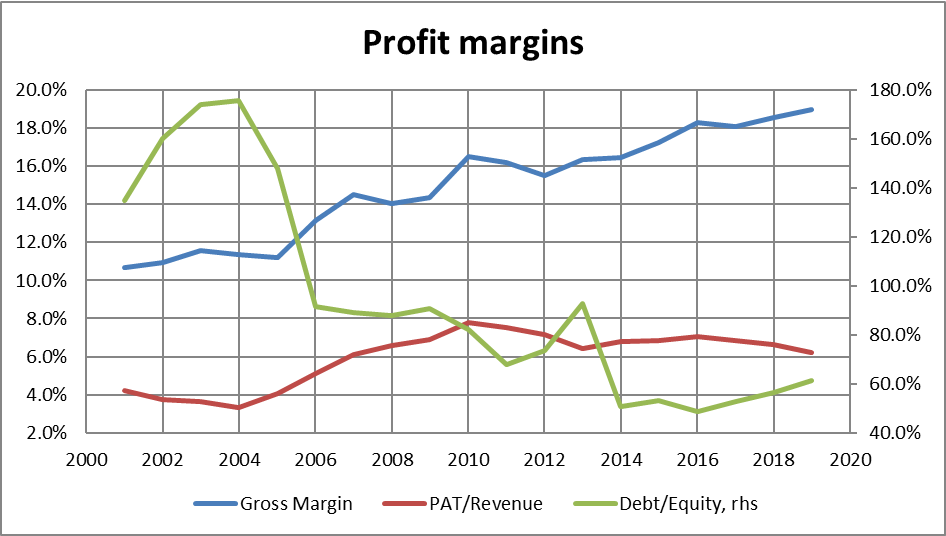
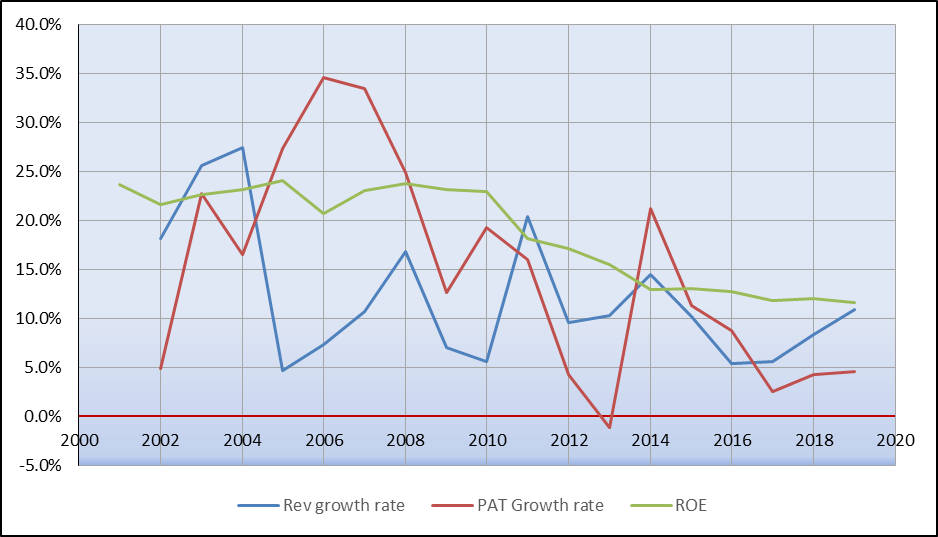
Looking at the charts, I do not get the warm feeling that net profit margin will rebound higher anytime soon. Yes, in absolute numbers, net profit will climb. The net profit growth rate is lower than the revenue growth rate in the past three years.
Return on equity (ROE) is also on a down trend.
Valuation
As can be seen from the above, revenue generated from ever newer plants, properties and equipment is getting lower year on year. Staff productive is also creeping down.
ROE is on the down trend too.
Operating expenses is increasing faster than the increase of revenue leading to lower nett profit margin. Higher debt financing cost is also not helping.
Another way to look at PE is the number of years one required to recoup the money used to buy the company, that is 54 years based on RM 8 per share (close 24/4/20).
Happy investing.
The usual disclaimer applies, this is for education purposes ONLY.
Me and my family no longer hold QL shares.
On 4 Jan 2019, I posted - QL what is the value?
Now, 25 April 2020, a year plus 3 over months and bored by MCO, I relook at the thesis and here are the findings.
Operation Matrices
One of the important matrices would be staff cost – every ringgit spent on staff brings back how much revenue. Similarly, all things being equal, every ringgit depreciated of plants, properties and equipment (PPE) brings in how much revenue.
And the operating expenses to revenue, is it increasing or reducing.
Here is how they look like: -

The operating expenses to revenue are unfortunately increasing yearly. Diving into the cost make-up, the two biggest item is depreciation of PPE and staff costs.
Staff productivity is reducing, the trend is downward. Revenue to depreciation is dropping at a higher rate. That is, the more plant, properties and equipment bought is giving less revenue every year.
Looking at operating segments of the annual reports, one can obtain the revenue generated from the asset deployed for the various serments.
It does not look good at all. Palm oil is returning less than one ringgit (RM0.65) as well as marine products (0.88) while integrated livestock farming is above one ringgit (1.11).
The general trend of all is creeping DOWN.

Cash flow
The next important aspect of a company is how much cash is it generating from operation and is it more than its need to purchase PPE, forget about investing in subsidiaries, associates and the likes.
QL does not generate enough cash (from operation) for investing in the necessary PPE. It takes loan and obviously the debt to equity ratio has been creeping up. Also, its ability to generate cash from operation is rather erratic (the blue line).

With all the above added together, the indication is that while gross margin is improving, the ever-lower staff productivity, low return of PPE plus increasing financing cost from higher debts all cut into the net margin that is now approaching 6%.
The trend is, net margin will reduce further going forward.

Looking at the charts, I do not get the warm feeling that net profit margin will rebound higher anytime soon. Yes, in absolute numbers, net profit will climb. The net profit growth rate is lower than the revenue growth rate in the past three years.
Return on equity (ROE) is also on a down trend.

Valuation
As can be seen from the above, revenue generated from ever newer plants, properties and equipment is getting lower year on year. Staff productive is also creeping down.
ROE is on the down trend too.
Operating expenses is increasing faster than the increase of revenue leading to lower nett profit margin. Higher debt financing cost is also not helping.
Another way to look at PE is the number of years one required to recoup the money used to buy the company, that is 54 years based on RM 8 per share (close 24/4/20).
Happy investing.
The usual disclaimer applies, this is for education purposes ONLY.
Me and my family no longer hold QL shares.
https://klse.i3investor.com/blogs/teoct_blog/2020-04-25-story-h1506135641-QL_one_year_on_any_changes.jsp
