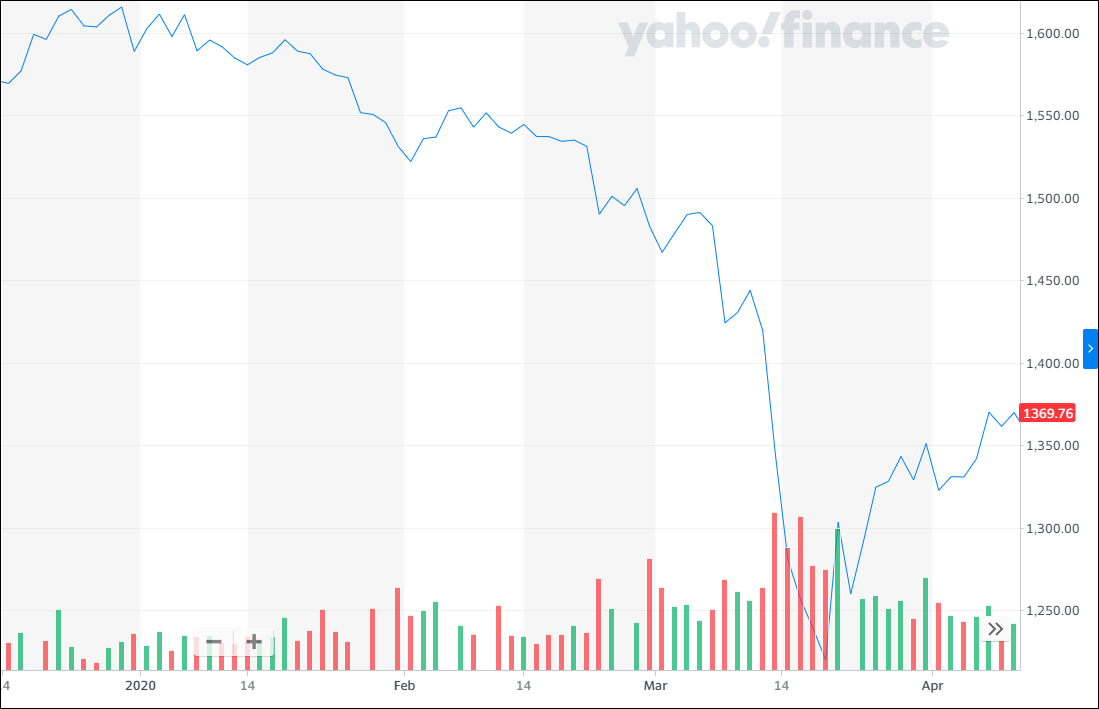
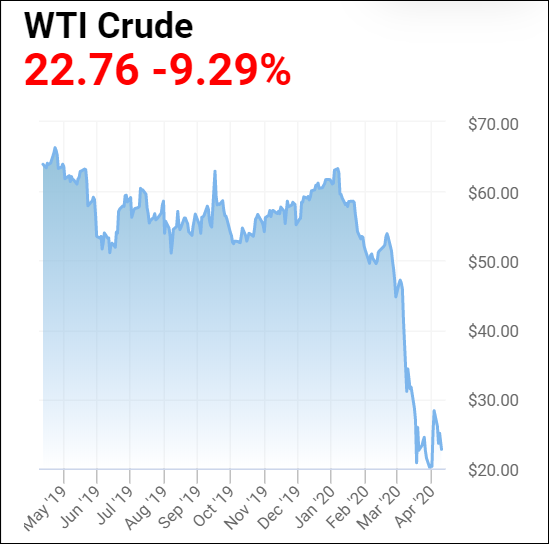
The KLCI and Oil price charts are self-explanatory. The 2 charts show that our Malaysian stock market has been depressed. Practically all the listed shares have been dropping quite rapidly. Until Covid 19 pandemic is under control, almost all listed stocks will continue to drop.
KLCI Chart

Dayang price chart

Oil price chart

Based on price chart
The above Dayang price chart shows that it has dropped from Rm 2.95 to the lowest of 76 sen and rebounded quite rapidly. Unfortunately, it has been dropping in the last few days which indicates that the trend reversal is not sustainable. If you just based on price chart, it is not safe to buy Dayang at this price level.
Based on fundamentals
Let us examine the basic fundamentals concerning Dayang’s business. Due to the shutdown of all the major cities around the world, air flights, railways and motor vehicles movement are restricted. As a result, the demand for oil will be greatly reduced. Petronas has already announced that the company has shut down a few of its oil rigs which will affect Dayang’s future revenue and profit.
As you know, all the major cities are shutdown, more people are using face masks when they go out and people are practising social distancing seriously. I believe Covid 19 pandemic will be over in a few months. Until all the people are free to move about, the demand for oil will remained bleak.
I have sold all my shares even at a loss. I will only start buying Dayang again when its price chart is showing a definite up trend and the oil price recovers to a more reasonable level so that Petronas will increase its operation.
https://klse.i3investor.com/blogs/koonyewyinblog/2020-04-10-story-h1505923411-Covid_19_Depressed_Stock_Market_Koon_Yew_Yin.jsp
