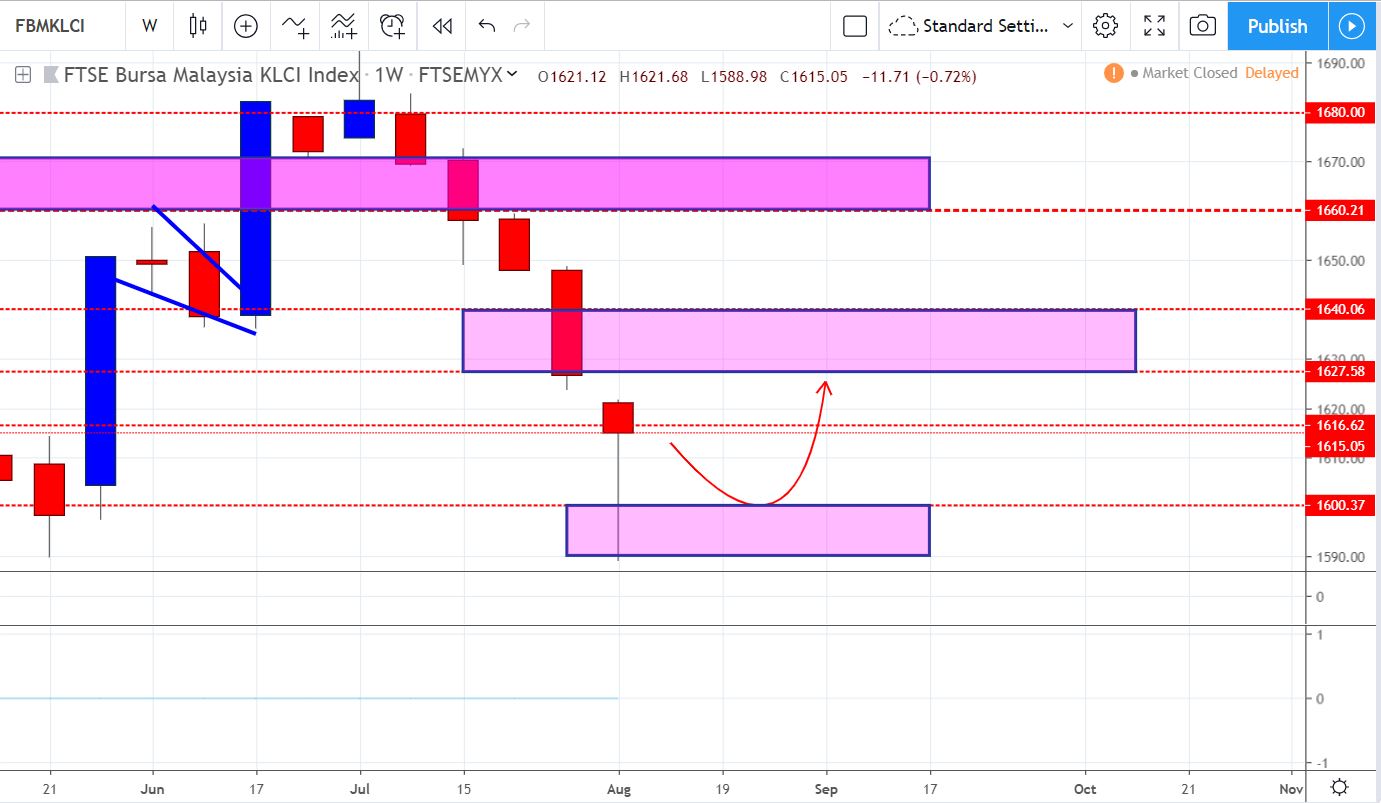
Weekly

For full explaination in video (in mandarin)... u may click below link:
https://www.youtube.com/watch?v=i6sJOP-ez8s&t=16s
KLCI weekly shows a hammer alike candle,
it shows that there are possible REBOUND on upcoming week. (well, hammer doesnt mean market will / confirm rebound)
it only shows Bear has weakening, and BULL has try to taking over the control.
 \
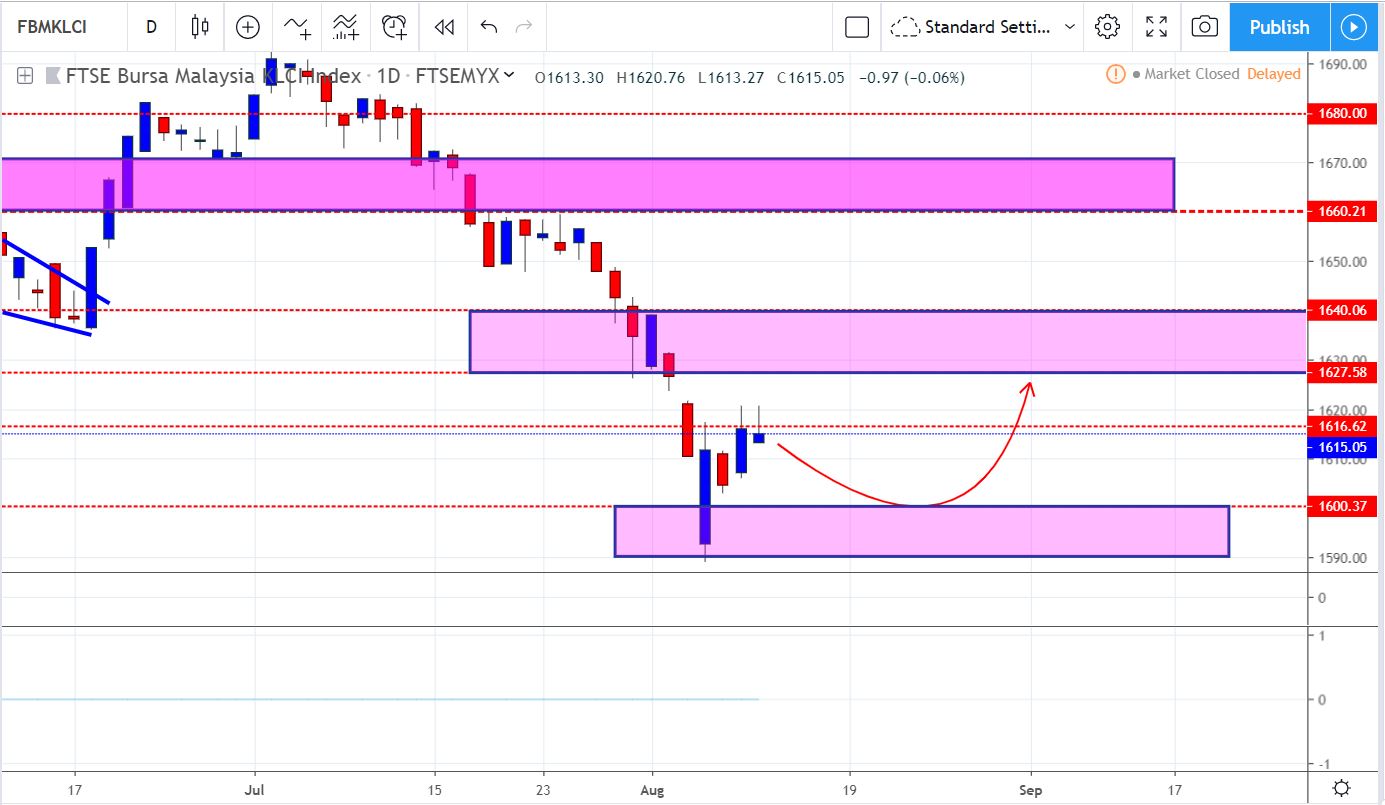
\lets see on Daily chart..
if based on daily chart... BEAR structure still there.... as we can see classic higher low, lower low...
this bull fight back is due to market has oversold, ... and market try to make a rebound
(rebound NOT reversal... both are diff meaning)
for Resistance, we need to watchout
1616 , 1627, 1640
for Support, watchout
1600, 1590..
Follow our facebook page:
For Stocks , KLCI , Bursa
For Fx, futures and Crypto
Follow our Telegram:
For Fx, futures and Crypto
For Stocks , KLCI , Bursa
Disclaimer:
Please be informed that our analysis are solely for education purpose;
it is neither a trading advice nor an invitation to trade.
For trading advice, please speak to your remisier or dealer representative.
You are responsible for your own risk management
Do Your Own Due Diligence (DYODD)
https://klse.i3investor.com/blogs/BullandBearfb/219029.jsp
For trading advice, please speak to your remisier or dealer representative.
You are responsible for your own risk management
Do Your Own Due Diligence (DYODD)
https://klse.i3investor.com/blogs/BullandBearfb/219029.jsp
