For more posts: http://www.geraldkohstockcharts.com
FB page: https://www.facebook.com/geraldkohstockcharts/

We notice history repeats itself throughout the human history; so does the stock market. Stocks are operated by big operators, normally we refer them as smart monies. For Richard Wyckoff, he called them the “Composite Man”. By identifying the large operators’ trading activities, the retailers would be able to increase their winning probabilities.
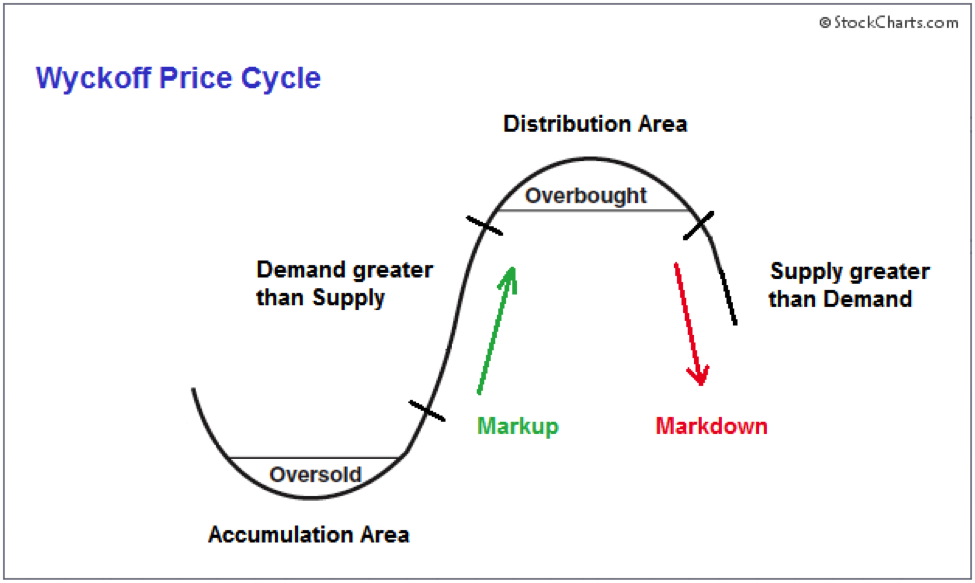
The first picture shows the Wyckoff Price Cycle. It possesses accumulation area, markup, distribution area and markdown. Accumulation area is the oversold region or the bottom we encountered in a chart such as double bottom, inverse head-and-shoulders or cup-shape. It doesn’t means these are the definite winning zone to buy, I can tell you that there are plentiful of stocks with accumulation phase in KLSE. Accumulation area could takes 6 months or even years for the large operators to accumulate the stocks.
Markup, the green zone where the demand is greater than the supply. Normally markup is carried out quietly without being noticed by the retailers. Hardworking retailers would be able to identify it. This is the perfect time to buy for retailers.
After markup, it’s time for large operators to distribute their shares. This is the period when good news or good quarter result is reported. That’s the reason I always advice retailers not to “chase high”. Not an easy job, I even got bad comments from the people who hope the price would go higher.
Finally the markdown, the supply is greater than the demand. Normally the price reduces slowly with low volume. The retailers are hoping the price will goes up and choose to average down while the large operators continue the distribution of their shares to the retailers. That’s why we always emphasise not to average down the purchase price. Do not love the stock, it won’t make you money.
This is the general view that breaks stock into four phases. I will discuss the details of the accumulation phase on my next post. Some traders pay fee to get this information, actually it is on the internet. It’s free.
https://klse.i3investor.com/blogs/geraldkohstockcharts/216387.jsp
