Hi to all fellow investors and traders !
Today I would like
to highlight a stock which I think might be posting a superb/consistent
quarter result in May 2019. That stock is PCCS GROUP BERHAD or PCCS (Code 6068, Main Board, Consumer Products/Services).
PCCS (BSKL Code 6068)
Personal TP Short To Mid Term : 57c, Long Term : 81c
Here are my thoughts :
1. Study of Latest 4 Quarter Results - Important Findings !!!
Please bear with me while I explain my findings on the latest 4 Quarter Results analysis:
i. Undervalued Counter - Currently Trading at PE Ratio of 5.2 of Forward PE
Refer below
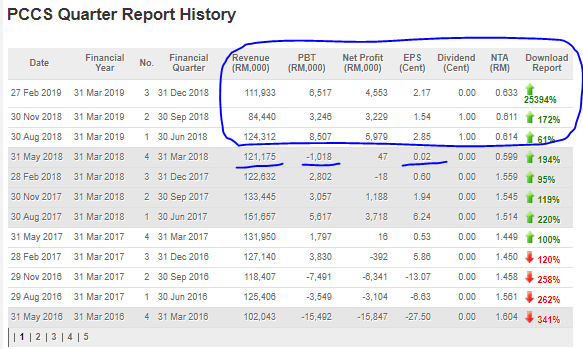
screenshot for PCCS QR summary. Latest 3 quarter results shows total EPS
of 6.56 cents. NTA of company remains at 63.3 cents as of recent
quarter.
Last year May 2018
report, PCCS has recorded a small net profit of RM 47,000 on the back of
revenue of RM 121 million. This was mainly due to the high
administrative & selling/marketing expenses incurred.
If we take a
conservative 2 cents EPS for May 2019 target, the full year EPS will be
at 8.56 cents. This means at current price of 44.5 cents, the company is merely trading at 5.2 ratio of forward PE !!!
Taking a reasonable 9-10 PE Ratio as TP, the stock should be worth around 77 - 86 cents in the longer term !!
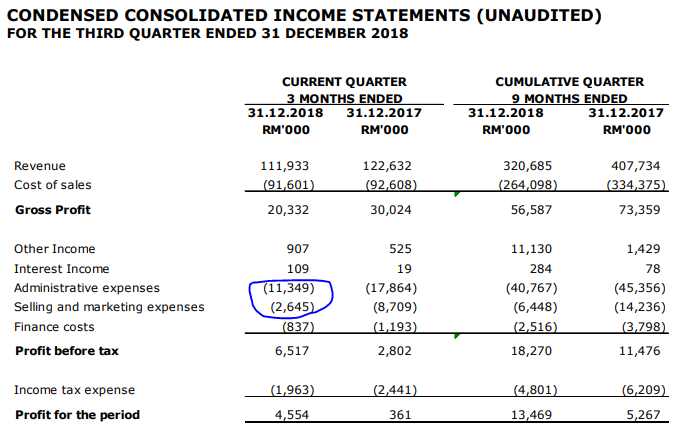
ii. Reduction of Expenses - Company Commitment to Improve Bottom Line
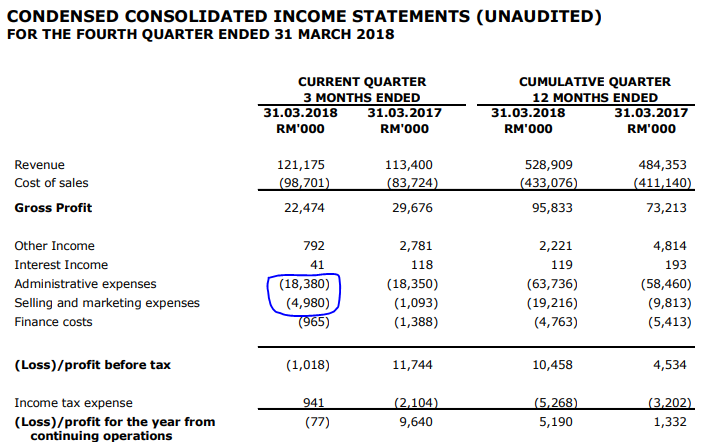
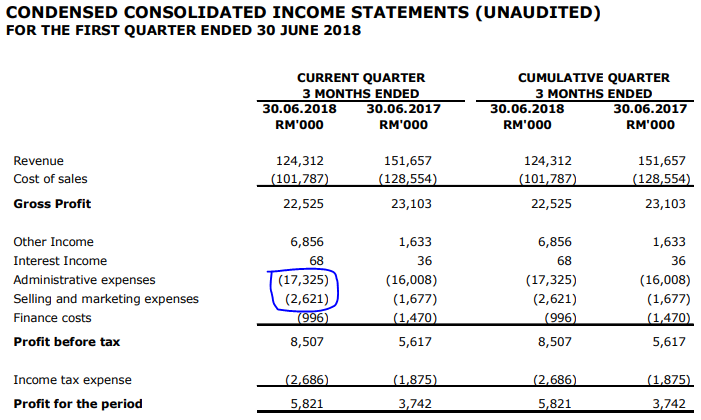
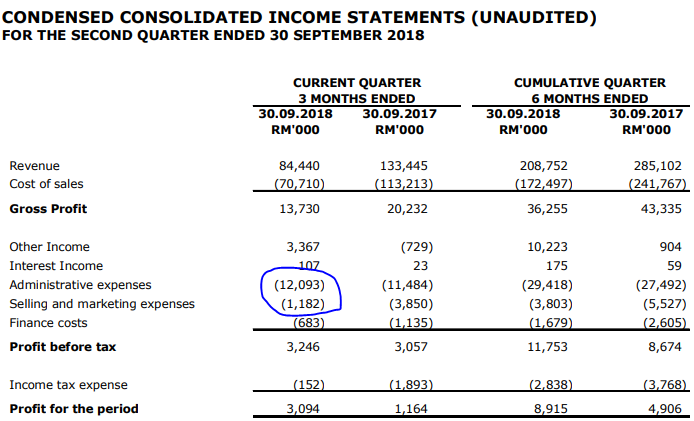
Refer below the
latest 4 quarters income statements. I had circled the issue which I
wish to highlight here, which is the Administrative &
Selling/Marketing Expenses.
We can see, that
the Company has SIGNIFICANTLY reduced its administrative &
selling/marketing expenses in the latest 2 quarters (from 23.4 m, to
19.6 m, to 13.2 m and 13.9 m). Cost savings of roughly RM 6-10 million (30-50%) to
improve company bottom line. I foresee that this improvement shall
carry on to the latest QR of May 2019, indicating the company's
commitment and consistency in reducing costs to improve profit for its
shareholders.
iii. Disposal of Asset Worth RM 8.5 million, Yet to Be Captured as Profit ???
Refer again the latest 4 quarters Cash Flow Statement as below. I will circle the part which I wish to highlight.
If you notice,
there was no disposal of RM 8.5 million captured in the May 2018 QR.
However, this item started to appear in Aug 2018, Nov 2018 and again in
Feb 2019 report. I believe this disposal was still in progress and
therefore has not yet been reflected as a gain in the income statement.
There
is a high possibility that this RM 8.5 million disposal might appear as
a realized gain, whether in May 2019 or August 2019 QR,
as usually assets take about 6-9 months for disposal and realization of
gains. Should this gain appear in May 2019, this would positively boost
up the EPS of this counter and reflect a higher target price.
May 2018 QR:

Aug 2018 QR:

Nov 2018 QR:

Feb 2019 QR:

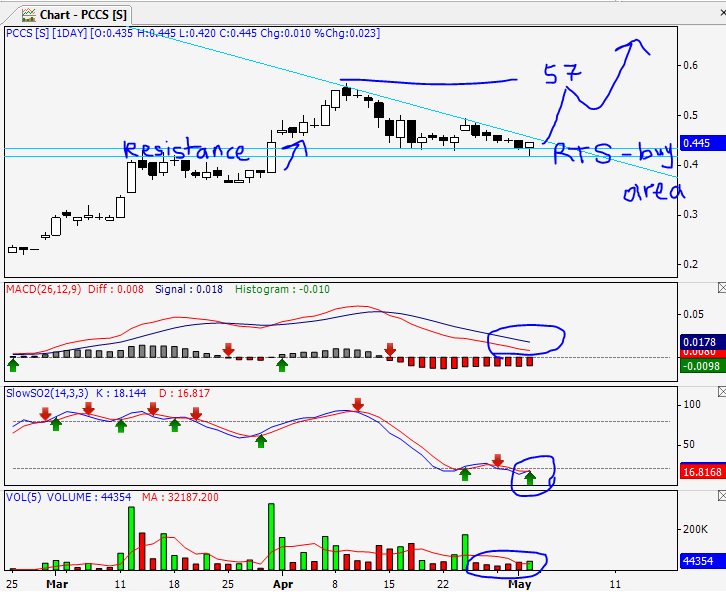
2. Technical Analysis - Consolidation in Bullish Flag Formation About to End
Refer below daily
chart of PCCS. Price had peaked to 56.5 cents on 9 April 2019 and had
since then been in retracement along the bullish flag pattern.
As we can see, the 42-43 cents area had become an RTS (Resistance Turned Support) Area,
which buyers had been supporting lately. There had been 5 times where
this counter had stepped into this RTS band, and price has rebounded
from the lows.
MACD is
consolidating towards a crossing soon, whilst stochastics indicated that
the counter is oversold and starting to buck the trend.
I foresee, that a breakout
of this flag pattern shall allow this counter to trend back towards its
recent high of 57 cents, then move towards its long term target of 81
cents.
CONCLUSION
Based on my
opinion, PCCS should be reporting a good/consistent May 2019 QR which
will support its uptrend continuation, based on below:
i. Total anticipated EPS full year at 8.56 cents. Taking 9-10 PE Ratio, the stock should be worth around 77 - 86 cents.
ii. SIGNIFICANT reduction of RM 6-10 million (30-50%) in its administrative & selling/marketing expenses in the latest 2 quarters, indicating company commitment to improve bottom line.
iii. Asset Disposal of RM 8.5 million, pending to be captured in the income statement
iv. Ending Its Bullish Flag Consolidation - Potential Uptrend To Recent High of 57 cents, and long term TP of 81 cents
Thanks for reading and see you in the next post.
THE ABOVE IS NOT A BUYCALL AND ONLY A PERSONAL OPINION ARTICLE AS A SHARING TO BSKL COMMUNITY MEMBERS.
Yours Truly,
INVESTHOR
https://klse.i3investor.com/blogs/InvesthorsHammer/205035.jsp
