Original Blog:http://www.geraldkohstockcharts.com/
In 2017, Armada formed a so-called ascending triangle and the
resistance was broken on 5 January 2018 with a high volume. I had
accumulated the stock during the consolidation between trading range of
RM0.80 and RM0.90; Average price was RM0.82. I thought this could be a
good play since it looks like a sign of strength. On 13 April 2018, the
RM0.90 resistance was broken with high volume. However, the supply arose
on 16 April 2018 and the climatic selling continued. I sold it before
it breaks the RM0.80 support.
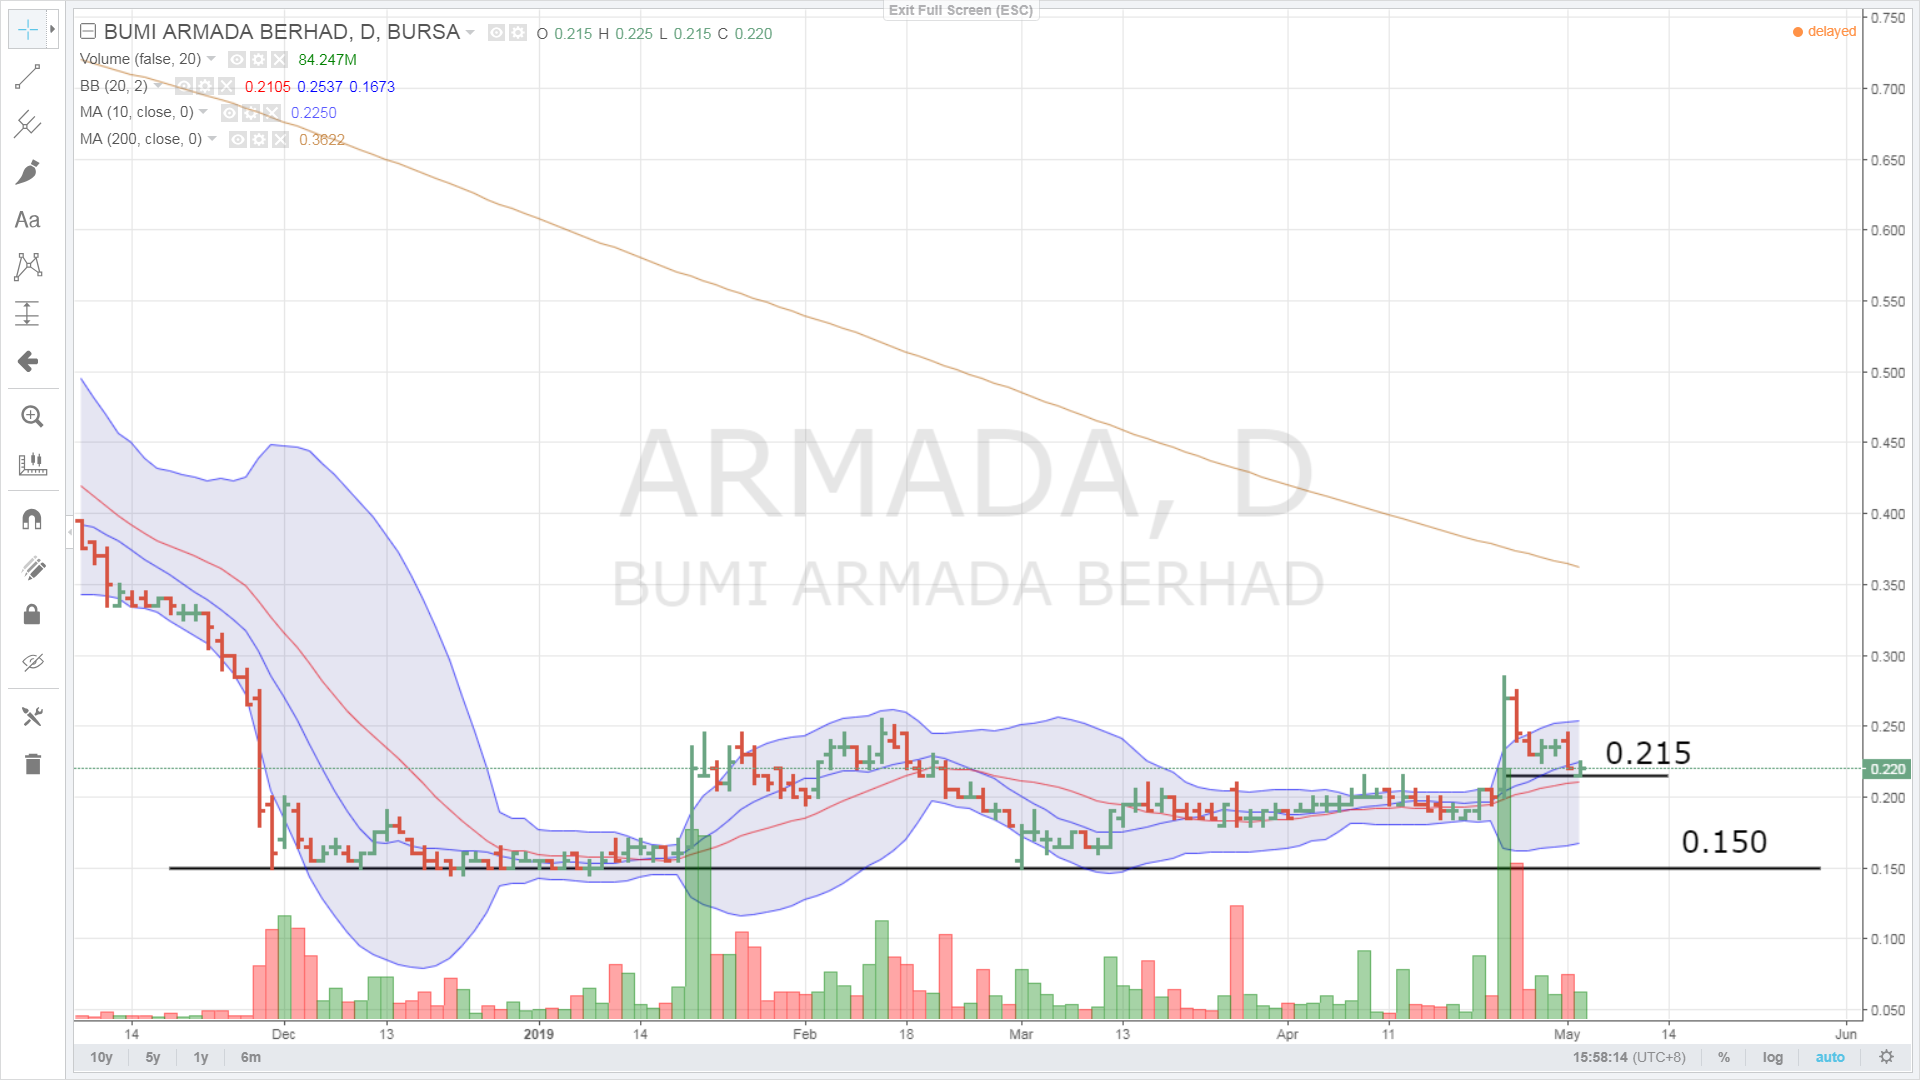
The stock extended the selling and found support at RM0.15
The support looks like an accumulation with high volume. Presently RM0.215 is the short term support; if the support is broken the next support will be RM0.15. Cut lost should be made below RM0.215.

The stock extended the selling and found support at RM0.15
The support looks like an accumulation with high volume. Presently RM0.215 is the short term support; if the support is broken the next support will be RM0.15. Cut lost should be made below RM0.215.

https://klse.i3investor.com/blogs/geraldkohstockcharts/205095.jsp
