Getting stuck in a losing stocks is suffering, with those fear of losing more gives you sleepless night, hoping the bear will go back to the forest when you wake up.
To help more traders and investors in the market, we want to share out this technique that you can avoid getting stuck in a bear market.
First thing you need to know is how these big boys attract buyers? Is the same of how marketing is done. Ask yourself, in what kind of circumstances that you will jump into a stock? Technical Entry, Huge buyers, huge buying interest & sometimes because of good news.
As you can see, the above reasons that trigger you to enter into stocks is by creating greed in you. It makes you feel that “A stock that you can’t miss!” and this is how many traders got attracted into a distribution stocks.
So here are a few ways that is shows the sign that trigger your greed to buy the stocks.
Buy Sell Queue
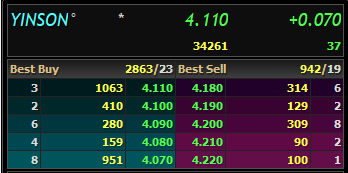
Sometimes you might see a huge buy queue at a certain price in a stock. Many will assume that is the “Support”, because they think there are many buyers. In fact the figure in buy sell queue doesn’t represent buyer or seller, because those are just order and is not transacted, it can be withdrawn at anytime. The big boys will queue there to let you think there are many buyer so you will enter that stock thinking is a support so you are safe WHICH is NOT!
High Volume + Price Increase
If you look into technical analysis or Volume Price Analysis when you see a white/ green candle (Up candle) with high volume you will think the stock is bullish. But why still stuck in such stocks?
The reason is very simple, big boys created that big volume and price up to attract you in, they play with your greed.
That's why we will never just look at the daily chart. To find out whether the big boys are attracting you to come into the stocks, look into the 5 minutes chart and you will find many funny price and volume movement that is indicating they want to sell the shares the next day.
Just like our recent trades on KPSCB and PICORP.

Daily Chart
In the daily charts you might see the redbox area with high volume in thinking there are more buyers going into PICORP. But from what we see in the 5 mins chart, is showing many selling pressure with high volume in at 1 price level but not able to push higher. Then they sell their shares down to those who queue at buy queue to distribute, because traders like to queue at lower price to buy shares which they always have this thinking that they want to buy shares cheap. Always remember, cheap thing comes with a price too.

5 Minutes Chart
Fear of going into stocks that move up a lot in a day
Another scenario is many traders in the market are afraid of moving into the a stocks that moves up a lot in a day. They always have this mindset, “price go up 10% already still can go up ke?”, “Price is too high, dangerous.”.
Obviously from the above statement you can see this group of traders are judging the stock based on THEIR OWN expectation instead of listening to the market. Stock market is a great place to prove that anything is possible. When you think price is too high, it goes up higher, if you think price is too low to drop more, it goes down further. I believe many of you experience this before.
But we can’t blame those traders or investors have this kind of mindset, because they do not know how and where to listen to the market. The available education in the market are mainly based on hope but market as listening to the market.
One of the common examples is profit target, many strategy set profit target which based on the previous price hike or their expectation. But often when the price is halfway to profit target it turn south, which many traders have no idea what to do but just HOPE that the price don’t hit the cut loss point and HOPE the price to continue to go up to profit target. All they can do is pray, worst thing is the price hit cut loss and bounce back to your profit target. Then traders are stuck in the losing trades again and having sleepless night again.
Solution
Here is what a true traders need to do, understand the big boys language and react to it. When you start to see they have no intention to push the price higher, take profit. Just like how we did in PICORP and KPSCB.
At our entry time KPSCB was already up for 14.15%, 0.075 sens up! You might say we are crazy, but we still move in because of 1 reason, the price & volume shows that they still have intention to push higher. At the end of the day, KPSCB closed at 25.47% up, 0.135sens up.

The next day we took profit at 0.79 sen, with a 30.58% gain with 1 day holding period only! The reason we take profit is because it match our take profit rules that the big boys show us in 5 mins chart that they have no intention to push higher.

Well, some might say we are just lucky. If is only luck, we have loads of luck in trading, we still have many examples to show you if you want to know more. Most importantly, our members are able to catch this too!


So how do we see KPSCB is time to exit is exactly the same as PICORP

Daily Chart
Now you have see the brief explanation of how the big boys plan on their distribution in 5 mins chart movement. When you see a few stocks have the same price movement is consider normal, but if you see whole market are having the same movement, then is telling us that the market is going down soon.

5 Mins Chart
Find out more in our next webinar class on 22/3/2018, Thursday at 8:30pm on more explanation.
Registration at the link below :
Find out more about how we track big boys effectively in our Facebook and YouTube Channel :


This blog is for sharing our point of view about the market
movement and stocks only. It is not and advice or recommendation to buy
or sell financial instrument. Viewers and readers are responsible on
your own trading decision. The author of this blog are not liable for
any losses incur by any investment or trading.
