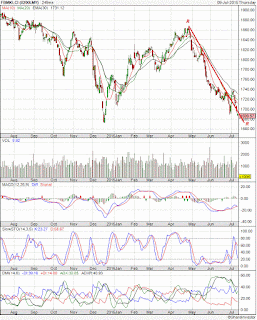
Chart 1: FBMKLCI's daily chart as at July 9, 2015_9.30am (Source: ShareInvestor.com)
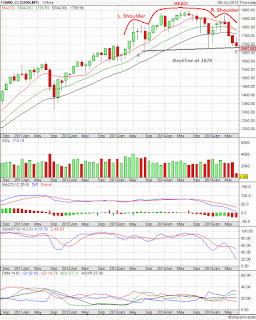
Further decline in FBMKLCI may see the index testing the neckline of a Head-and-Shoulder formation. This very relevant reversal formation would be triggered if the neckline at 1675 is violated. We hope that the index will have a quick recovery today in order to avoid a nasty confrontation with the neckline at 1675.

Chart 2: FBMKLCI's monthly chart as at July 9, 2015_9.30am (Source: ShareInvestor.com)
http://nexttrade.blogspot.com/
