28/Feb/2020.
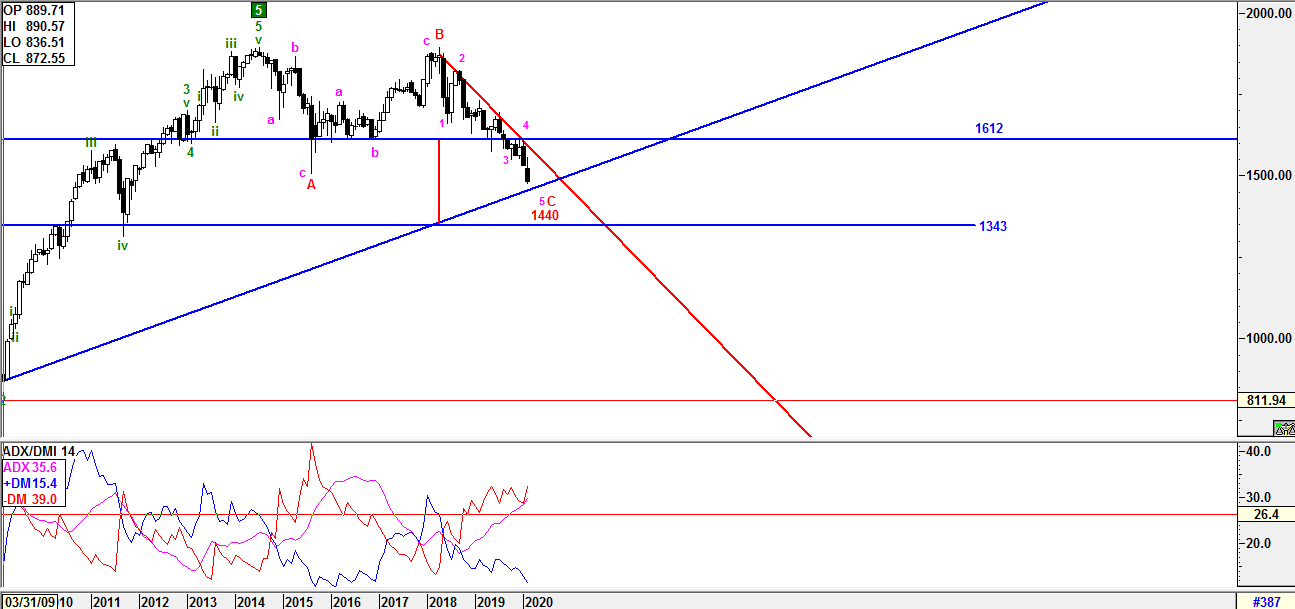
The chart above is derived from Monthly time frame which provides longer term view based on Elliot Wave Theory.
From the price actions above, we can see KLCI has formed an Double Top formation which first and second top occurred in 2014 and 2018 respectively. The probability of the formation validity is high when it broke below the support 1612 on September 2019 and target price level is 1343. ADX indicates Bear is still strong and selling pressure is in favour.
From Elliot Wave perspective, the Final major degree bullish 5th Wave was ended in 2014 and expanded irregular major degree ABC correction waves has been emerged until now which comprises 3-3-5 lower degree sub-wave formation. Wave A (3 sub waves) & B (3 sub waves) had been achieved on August 2015 & April 2018 respectively. Currently, KLCI is still forming a major degree Wave C with lower degree 5th sub wave which expecting to end at 3 possible levels below:
a) 1460 - reversal above upper trend line and earlier double bottom formation may be void.
b) 1440 - break below upper trend line and reversal above upper trend line as false break.
c) 1343 - break below 1440 indicates extension 5th sub wave heading further lower to 1343
Once one of these 3 level achieved, it would be the end of major Wave C at the same time. Therefore, the entire ABC correction would be achieved and confirmed if it breach above the red downtrend line.
The analysis above is based on case by case basis at one point in time because of the price behavior variation.
Thank you.
Regards
Wave believer
28/Feb/2020.
https://klse.i3investor.com/blogs/E_Wave/2020-03-01-story-h1484655431-KLCI_waves.jsp
