1. Introduction
According to Kenanga Investment Bank, Yinson is expected to experience spike in earning in calender year 2020 (FYE Jan 2021). Its historical and prospective PER is 27 times and 17 times respectively.
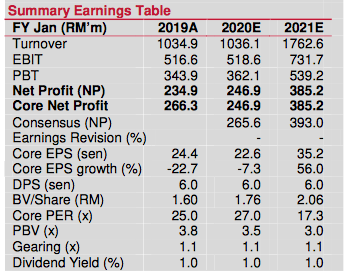
(Source : Kenanga IB analyst report for Yinson dated 28 June 2019)
On the other hand, according to Hong Leong Investment Bank, Armada is trading at historical and prospective PER of approximately 5 times.

(Source : Hong Leong IB analayst report dated 3 June 2019)
It is true that Yinson has stronger balance sheet (net gearing of 1.1 times) compared to Armada (net gearing of 2.7 times). But as long as Armada can service its debt obligations (recent indications are they can), maybe we should not let balance sheet weakness completely shut us down.
Let's take a closer look.
2. Historical Profitability
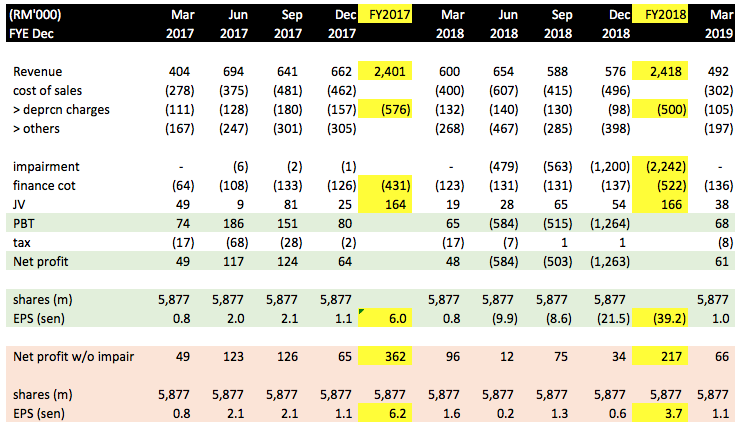
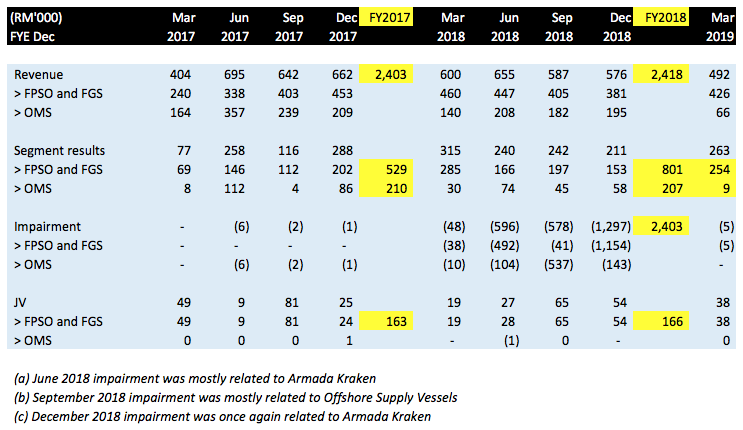
The followings are Armada's historical P&L from Q1 of FY2017 until Q1 of FY2019 :
Key observations :
(a) annual revenue of approximately RM2.4 bil. Existing order book is approximately RM20 bil (firmed order book). Simple calculation shows that it can last at least 8 years, even without additional contracts secured.
(b) Annual interest expense of approximaely RM500 mil. As borrowings outstanding is approximately RM10 bil, effective interest rate is approximately 5%.
(We need this piece of information for modelling of future income, cashflow and balance sheets, as shown in later part of this article.)
(c) In FY2017, the group has property, plants and equipment (PPE) of RM9.5 bil (year average) and depreciation charges of RM576 mil. This translates into PPE lifepan of 16 years.
The group made huge provision for impairment of RM2.4 bil in FY2018. Divided by 16 years, depreciation charges will be lowered by RM150 mil per annum (or RM40 mil per quarter). A quick check shows that this is indeed the case as March 2019 quarter's depreciation charges has dropped to RM105 mil (from approximately RM150 mil in FY2017).
In an earlier annual report, management has indicated that impairment is actualy not a bad thing. Apart from lowering depreciation charges (augurs well for future profitability), it also puts the group in better position to bid for contracts at lower price, thereby enhancing its competitivenss (OMS segment).
(d) The group reported net profit of RM362 mil in FY2018. But that was assisted by relatively strong OMS (Offshore Marine Service) contributions. The OMS division's order book is closed to being depleted. Going forward, we should be happy if it can just break even.
In the meantime, following completion of 4 FPSO vessels (Floating, Production, Storage and Offloading) in FY2018, contribution by FPSO and FGS (Floating Gas Storage, referring to the vessel chartered to Malta for Liquified Natural Gas storage for power generation purpose) will pick up. This has already shown up in higher revenue of RM801 mil in FY2018 compared to RM529 mil in FY2017. In Q1 FY2019, this division's revenue further increase to RM254 mil (if annualised will be RM1 bil revenue). The group's FPSO related revenue is likely to further increase once Kraken's operational issues are fully resolved and achieves final acceptance status (no idea by how much).
After taking into consideration the above, for the purpose of discussion, I would like to make the assumption that the group's earning capacity is approximately RM250 to RM300 mil per annum.
(e) Not to be overlooked is the group's 3 Joint Ventures in India and Indonesia. These joint ventures made consistent profit contribution of approxmiately RM160 mil per annum to the group in FY2017 and FY2018.
The joint ventures' contribution is not limited to equity accounting. A study of the group's cash flow statement shows that they occasionally flew cash up to the goup through a combination of dividend payment and capital repayment.
3. Balance Sheets
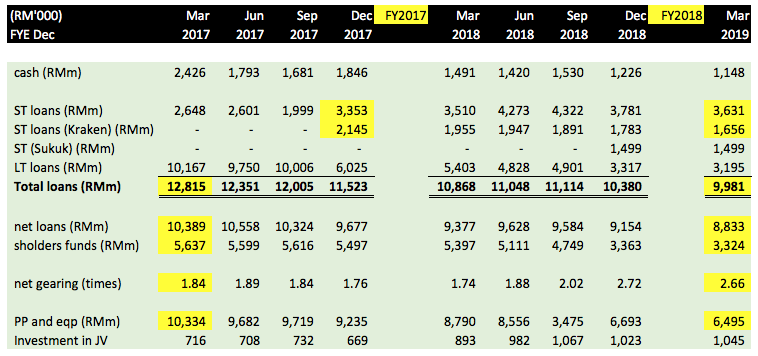
The followings are the group's balance sheet details over past two years :-
Key observations :-
(a) Armada Kraken was deliverd to client, Enquest, by mid 2017. However, it was not able to achieve acceptance status within the designated timeframe (meaning the vessel has not been able to perform according to full specifications). This caused it to breach the financing covenants, resulted in its long term loan being reclassified into short term loan.
There are some good news though. In March and April 2019, Armada Kraken has managed to improve its performance materially. It is not known when the vessel will achieve final acceptance. But at least it is heading in positive direction.

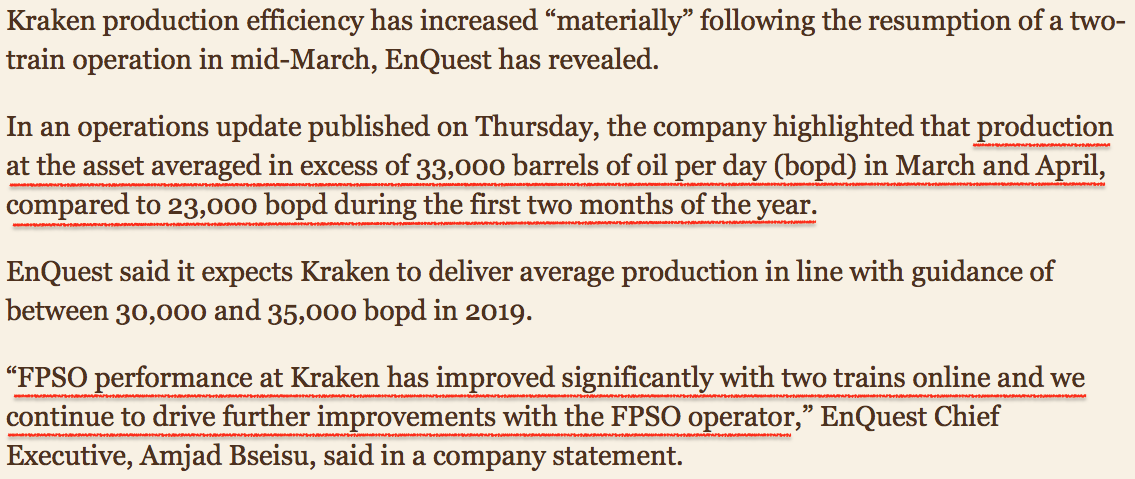
Please note that since breaching the loan covenants in Q4 of FY2017, the company has been paring down Armada Kraken's loans by RM486 mil (from RM2,145 mil to RM1,656 mil).
(b) On 24 April 2019, the company announced that it has successfully negotiated with lenders to refinance RM2.75 bil short term facilities into a single long term facility with RM1.07 bil and RM1.65 bil maturing in two and five years respectively. This removed a major risk of default.
(c) During the 2 years from Q1 FY2017 until Q2 FY2019, the group pared down net loans by RM1.56 bil (from RM10.39 bil to RM8.83 bil). This is equivalent to RM750 mil repayment per annum.
(d) Following huge impairment of RM2.4 bil in FY2018, property, plant and equipment declined from RM10.3 bil in Q1 FY2017 to RM6.5 bil in Q1 FY2019. Due to huge losses, shareholders funds also declined from RM5.6 bil to RM3.3 bil (a decline of RM2.3 bil). As a result, despite reduction in loans by RM1.56 bil (as mentioned above), net gearing increased from 1.8 times to 2.7 times.
4. Cash Flow
The followings are cashflow details :-
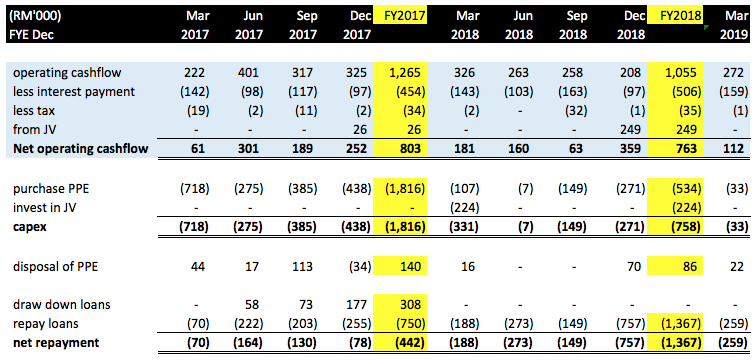
Key observations :-
(a) The group generated net profit of RM250 to 300 mil per annum. However, depreciation charges is approximately RM500 mil per annum. Added that back, net operating cashflow (already factoring in interest payment of approximately RM500 mil per annum) would be approximately RM800 mil per annum (ignoring changes in working capital as it tends to net off over years).
(b) In FY2017, the group incurred capex of RM1.8 bil. In FY2018, the amount was approximately RM758 mil. Going forward, capex is expected to be a lot lower as all the vessels had been completed and delivered (unless further capex is required to rectify Armada Kraken problems, which I think is unlikely to be big as material improvement has been achieved recently).
(c) In FY2018, the group's 3 joint ventures (2 in India, 1 in Indonesia) flew up a total RM249 mil cash to the group by way of dividend and capital repayment. Going forward, it is difficult to tell whether the same quantum can be maintained. However, for two consecutive years, these joint venture stakes have been contributing net profit of RM160 mil per annum to the group. I think going forward, dividend payment of RM100 mil per annum is a realistic assumption.
(d) In FY2017 and FY2018, the group disposed of assets amounted to RM140 mil and RM86 mil respectively. The group will continue to dispose of assets in the future to raise cash.
(e) Over the two financial years (2017 and 2018), the group made net repayment of RM1.809 bil. This worked out to be RM900 mil per annum.
5. Concluding Remarks
At current market cap of RM1.26 bil, Armada is trading at prospective PER of approximately 5 times. The group has weak balance sheets, but long term charters provide it with strong earning and cash flow visibility.
Gling forward, I think the most important factor to watch is Armada Kraken. If they managed to resolve all the problems faced by this vessel (indications are they are heading in right drection), the stock will experience a major re-rating.
https://klse.i3investor.com/blogs/icon8888/212924.jsp
