Highlights:
Company Background
LCTitan actually has a long history despite only being listed in its present form on 11/07/17 (IPO price is RM6.5). It first started operation in 1991 and was previously listed as Titan Chemicals Corp Bhd in 2005. It was subsequently privatised in 2011 after its takeover by Lotte Chemical. After six years of expansion and optimisation of its production processes, it was listed again under its current name.
LCTitan can be said to be regional petro-chemical giant which operates 14 plants in Malaysia and Indonesia with two main categories of products:
(1) Olefins -- Ethylene & Propylene -- and their Derivatives such as Butadiene, Tertiary Butyl Alcohol (TBA), Benzene & Toluene.
(2) Polyolefins -- I.e. Polyethylene (PE) & Polypropylene (PP).
Olefins and the base stocks from which the polyolefins are produced. Polyethylene and polypropylene can be said to be the most widely used plastic raw materials from which a very wide range of consumer and industrial products are produced. In FY17, polyolefins accounted for approximately 80% of the total revenue generated by the Group.
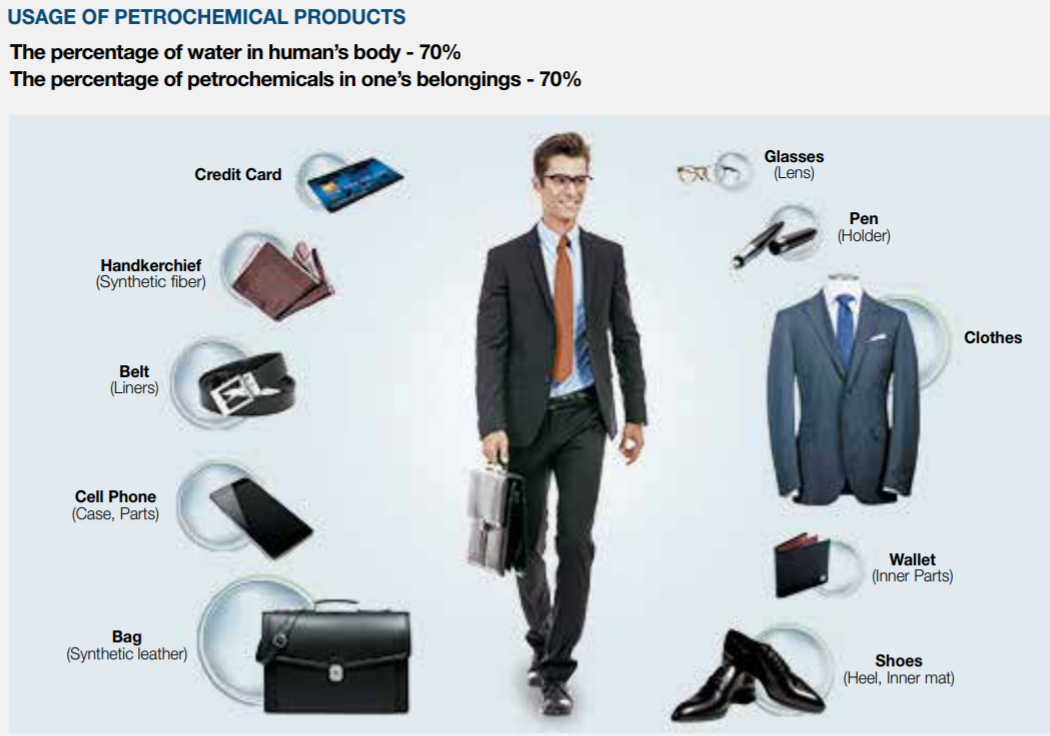
Underground pipelines, shared utilities and controls enable facilities on these sites to operate as a single integrated petrochemicals complex. Vertical integration of olefins and polyolefin production has enabled the company to add value and realize gains along the value chain while their customers have the assurance of consistent quality and dependable supply. This integration facilitates higher operating rates and cushions the impact of cyclicality. In 2006, Lctitan acquired PT Lotte Chemical Titan Nusantara, Indonesia’s largest polyethylene plant. This acquisition boosted the polyethylene capacity by about 80%, thus making it as one of the largest producers of polyolefin in Southeast Asia. Let see the application of Lctitan products as shown in the figure below.

Fundamental Data
Currently Lctitan is trading at PE Ratio of 12.18 (based on current price of RM5.10) with EPS of 41.87sen. Due to Lctitan is just listed in Bursa from 11 July 2017, we can only access to four quarters results from Bursa website. The figure below shows Lctitan’s revenue and net profit for past 4 quarters.

Source: www.malaysiastock.biz
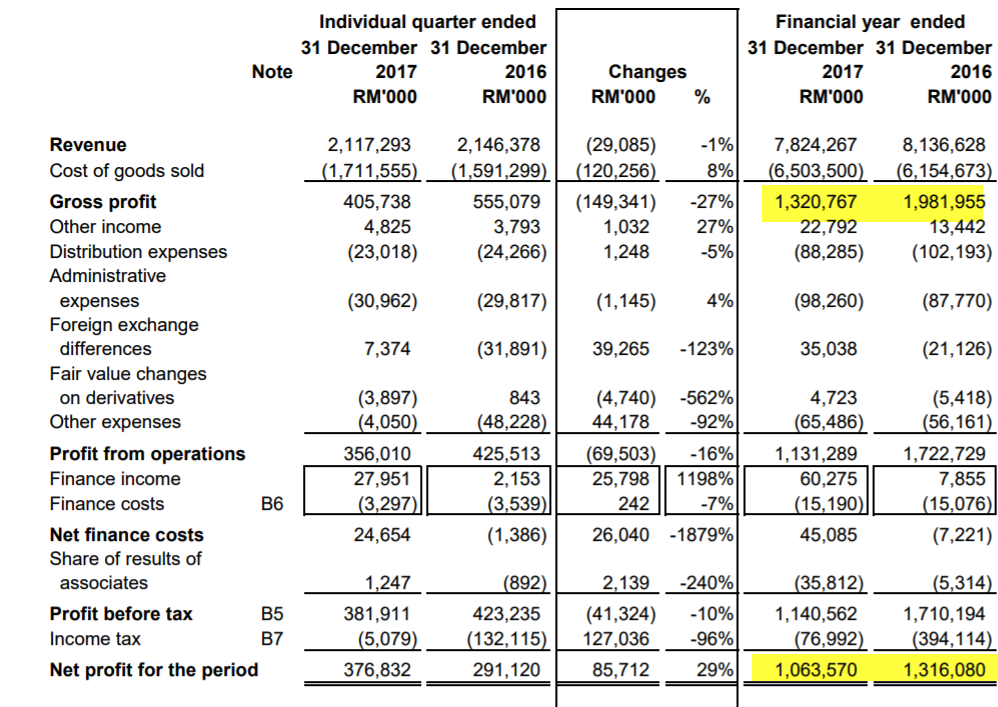
For a more comprehensive overview of Lctitan’s past financial results, let us go through the following table:

Source: Q1’18 report
Its revenue, profit margin and net profit has declined over past 1 year (2017) due to the following reasons:
It has good dividend yield of 4.4% and NTA of RM5 per share. It has dividend policy of 50% of the company net profit.
Key Financial Data
Let see an important financial valuation metric for Lctitan in term ROIC. I prefer ROIC than ROE as ROE did not include debt and cash and cash equivalent.
ROIC of Lctitan in FY2017= 13.45%
A rate of ROIC 12-20% per year is considered good ratio especially for petrochemical company. ROIC is a useful indicator for company that invests a large amount of capital, like petrochemical, oil and gas companies to measure its strength of turning capital into profit. ROIC of 13.45% indicates Lctitan is efficient in turning investors’ capital into profits.
Let us go through some key financial data (included latest result) of Lctitan as table below:
We can observe that Lctitan achieves high quality of earnings ratio of 1.69 to 1.12 for FY2017 and trailing 12-month (due to high depreciation). It also shows decent in ROE, ROIC, net profit margin, ROA and
dividend yield ratios for the past 12 months results. Lctitan has zero
borrowings and it has cash and cash equivalent of 3,564 mil. The net
cash per share is RM1.54 which is nearly 30% of the current share price
(RM5.22).
For a more comprehensive evaluation, I have use 10 metrics to evaluate Lctitan. pls refer to the table below for the details of the points scored by Lctitan.
This table I decided not to open to public at this moment.
Prospect and Fair value for FY2018
As the petrochemical industry is cyclical, new investments usually occur at the same time, following periods of sustained higher profitability. Cyclical changes in supply and demand are usually closely linked to economic growth patterns, especially in China given its strong manufacturing base.
Let us have a look on the commentary prospect of the latest Lctitan report as below:

Source: 1Q’18 report
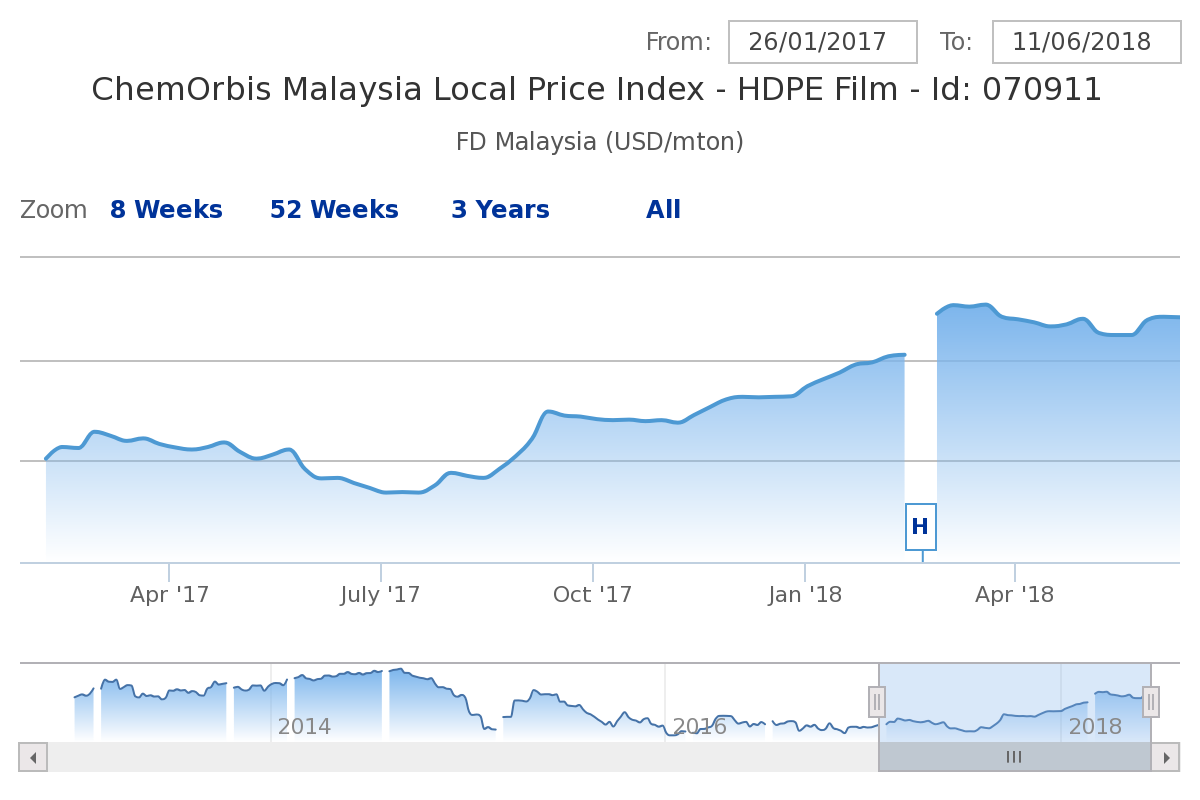
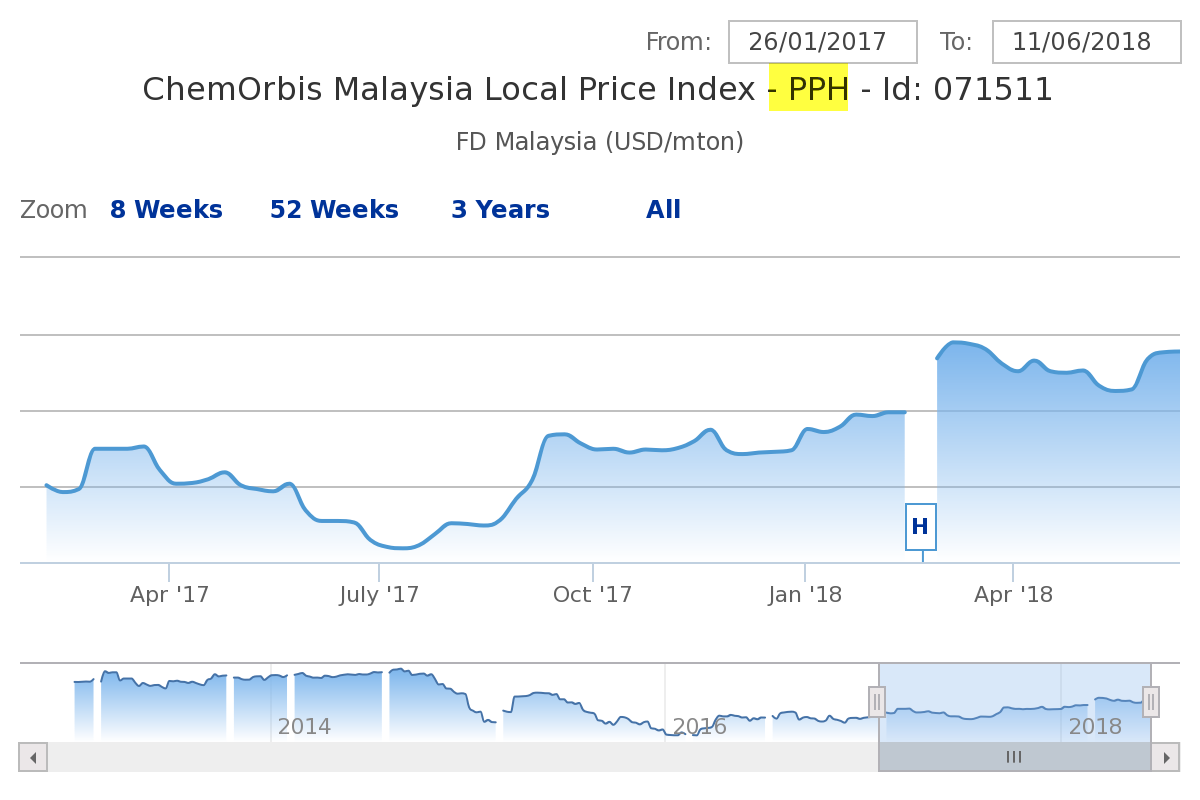
Let see the price of two Lctitan main products (High Density Polyethylene and Polypropylene) as shown in figures below:

Source: https://www.chemorbis.com/en/
 Source: https://www.chemorbis.com/en/price-index/
From the two price charts above, we can observe that prices of HDPE and PP are on uptrend from April to June 2018. Anyway, the price of naphtha also increasing due to crude oil also increasing during this period. I expect the profit margin of Lctitan can be slightly improved in 2Q18 and revenue should improve due to higher selling price and demands of PE and PP products especially general election 14 and Ramadan month fall in 2Q18 period.
According to the recent AGM and annual report of the Group, the TE3's fluidised Naphtha cracker plant started its operation in Dec 2017. The TE3 project in Johor is expected to raise the processing capacity of ethylene and propylene. I expect the TE3 plant to contribute positively to Lctitan's revenue from FY18 onwards. The management in AGM has guided for LCTITAN's production output to be normalised in FY18 on the back of no planned plant shut downs.
The Chinese government by Jan 2018 strengthen and clamped down on the production of petrochemical products to comply with pollution policy laws to improve their air quality. This clamped down ban import of toxic recycled plastic waste to china which may reduce China PP and PE products supply. This has caused some disruption in petrochemical supply as majority Chinese petrochemical factories are required to shut down to upgrade their facilities. In recent AGM, Lctitan management also stated that China’s recent blue sky policy which ban import on recycled plastic waste will affect the market supply, Under this situation, non-China petrochemical company like Lctitan is expected to win market share from petrochemical products in China. (https://www.agchemigroup.eu/en/blog/post/impact-chinas-blue-skies-environmental-policy-chemicals-sector)
(https://www.icis.com/resources/news/2018/04/20/10213862/china-will-totally-ban-import-of-waste-plastic-in-2019/)
Let us have a comparison of capacity utilization rate for FY2016, FY2017 and FY2018
I believe with normalized plant utilization back to 85%-90%, increase
ASP (average selling price) to cater for Malaysia and Indonesia higher
demands and supply shortage in China, this may improve revenue and
overall profit margin in FY2018.
Besides, higher car sales (more synthetic plastic like PP needed) will increase the sales of Lictitan’s products in Q2 and Q3 of 2018. This is once a life-time opportunity that should benefit petrochemical industry especially for Lctitan. (refer to http://www.craftechind.com/13-high-performance-plastics-used-in-the-automotive-industry/)
In addition, from the 2017 new TE3 plant upgrade, Lctitan has new 30% additional production capacity in FY18 which can meet higher demands in Malaysia and Indonesia. To date, Lctitan’s PP3 project, currently 91% completed, is expected to start commencing by June 2018 and full commissioning expected in 2H18. Lctitan’s LCUSA plant (40% share JV partnership) in Louisana, USA still work in progress, on schedule to operate by July 2019. In view of the expected improved plant utilization rate in FY18 and possible higher demand in Malaysia and Indonesia, I am projecting a full year EPS of 55 sen - 60 sen for FY2018.
Lctitan historical PEx range from 11 to 12.5 for the past 12 months. Currently Lctitan is a net cash company and zero debt with approximately 3,564mil cash in hand. Strong cash flow and zero debt provide the sustainability of the future dividend yield. Based on projected FY2018 56sen EPS (assume 10% EPS growth from FY2017 EPS even new plants contribute 30% additional capacity), the fair forward 12-month PE for should be in the range of 11x-12x (translated to RM6.16 to RM6.72). PE12x is consider reasonable valuation in petrochemical industry sector where its peer PCHEM currently trading at trailing PE at about 17x.
Let me have a SWOT analysis on Lctitan as below:
SWOT analysis (S-strengths, W-weaknesses, O-opportunities, and T-threats)
Risk
Appendix:
If you’re curious what plastics are recycled—and what happens to recycled plastics Below is a table that describe for the most commonly recycled plastics.
Note: resin means a type of plastic. The resin code is typically found on plastic packaging.
http://klse.i3investor.com/blogs/lionind/165354.jsp- Ramadan month falls in 2Q2018 may boost demands of Lctitan’s products (PP and PE are plastic raw materials which used in many consumer products and car) in Malaysia and Indonesia.
- Recent zero rated GST has boosted the sales of consumer products and new car, which requires more synthetic plastic (PP, polypropylene) for dashboard may increase the sales of Lictitan’s product in Q2 and Q3 of 2018.
- New TE3 and PP3 plants can increase their capacity by 30% on top of FY2017 capacity when running at 90% utilization.
- Expected to have double digit growth in coming 1-2 years based on higher demands from Malaysia (main market), Indonesia and China.
- Blue Sky Policy of China in 2018 requires petrochemical industries to comply with pollution policy laws which may reduce PP and PE products supply in china (confirmed by management in recent AGM which may create opportunity for Lctitan where its revenue from china improved over 100% when comparing 1Q18 vs 1Q17), (refer to section Prospect for more details).
- High dividend yields of over 4% which is higher than bank FD rate. Strong free cash flow provides sustainability of the future dividend payment.
- Profit in 1Q18 decreased YoY mainly due to two routine turnarounds (maintenance), forex loss of 44.6M, lower Indonesia polyethylene plant load, and margin squeeze due to time lag in selling price vs raw material.
- Strong balance sheet with Zero borrowing and the net cash per share is RM1.54 (3.56B cash) which is nearly 30% of the current share price.
- Assume 10% EPS growth in FY2018 (with 30% added new capacity), the fair forward 12-month PEx of Lctitan should be in the range of 11x-12x (translated to RM6.16 to RM6.72 based on FY2018 EPS). Its peer PCHEM currently is trading at trailing PEx at about 17x.
- The risk lies in big fluctuation in crude oil price which may affect its raw material cost but Lctitan has raised its products selling price in Feb 2018.
LCTitan actually has a long history despite only being listed in its present form on 11/07/17 (IPO price is RM6.5). It first started operation in 1991 and was previously listed as Titan Chemicals Corp Bhd in 2005. It was subsequently privatised in 2011 after its takeover by Lotte Chemical. After six years of expansion and optimisation of its production processes, it was listed again under its current name.
LCTitan can be said to be regional petro-chemical giant which operates 14 plants in Malaysia and Indonesia with two main categories of products:
(1) Olefins -- Ethylene & Propylene -- and their Derivatives such as Butadiene, Tertiary Butyl Alcohol (TBA), Benzene & Toluene.
(2) Polyolefins -- I.e. Polyethylene (PE) & Polypropylene (PP).
Olefins and the base stocks from which the polyolefins are produced. Polyethylene and polypropylene can be said to be the most widely used plastic raw materials from which a very wide range of consumer and industrial products are produced. In FY17, polyolefins accounted for approximately 80% of the total revenue generated by the Group.
Underground pipelines, shared utilities and controls enable facilities on these sites to operate as a single integrated petrochemicals complex. Vertical integration of olefins and polyolefin production has enabled the company to add value and realize gains along the value chain while their customers have the assurance of consistent quality and dependable supply. This integration facilitates higher operating rates and cushions the impact of cyclicality. In 2006, Lctitan acquired PT Lotte Chemical Titan Nusantara, Indonesia’s largest polyethylene plant. This acquisition boosted the polyethylene capacity by about 80%, thus making it as one of the largest producers of polyolefin in Southeast Asia. Let see the application of Lctitan products as shown in the figure below.

Fundamental Data
Currently Lctitan is trading at PE Ratio of 12.18 (based on current price of RM5.10) with EPS of 41.87sen. Due to Lctitan is just listed in Bursa from 11 July 2017, we can only access to four quarters results from Bursa website. The figure below shows Lctitan’s revenue and net profit for past 4 quarters.

Source: www.malaysiastock.biz
For a more comprehensive overview of Lctitan’s past financial results, let us go through the following table:

Source: Q1’18 report
Its revenue, profit margin and net profit has declined over past 1 year (2017) due to the following reasons:
- Group revenue and profit before tax (PBT) decreased mainly due to decrease in sales volume which is affected by two routine turnarounds (maintenance) in Malaysia plants (53 days and 33 days in 1Q and 2Q of 2017 respectively).
- Lower Indonesia polyethylene plant load due to tight ethylene supply resulting in lower production volume.
- Margin squeeze due to time lag in selling price as compared to their raw material cost in 1Q18 due to selling price only raise in Feb 2018.
- Lctitan’s plant utilization has dropped to 73% in 2017 from 91% in 2016 mainly due to unplanned shutdown caused by 13-days water supply disruption in 2Q17 and small fire incident in TE3 plant in 3Q17.
- Forex loss of 4.6M arising from the conversion of the IPO proceeds to RM from USD.
It has good dividend yield of 4.4% and NTA of RM5 per share. It has dividend policy of 50% of the company net profit.
Key Financial Data
Let see an important financial valuation metric for Lctitan in term ROIC. I prefer ROIC than ROE as ROE did not include debt and cash and cash equivalent.
ROIC of Lctitan in FY2017= 13.45%
A rate of ROIC 12-20% per year is considered good ratio especially for petrochemical company. ROIC is a useful indicator for company that invests a large amount of capital, like petrochemical, oil and gas companies to measure its strength of turning capital into profit. ROIC of 13.45% indicates Lctitan is efficient in turning investors’ capital into profits.
Let us go through some key financial data (included latest result) of Lctitan as table below:
|
|
FY2017 |
Trailing 12-month (from Mar 18) |
|
Average PE |
11.33 (EPS 51 sen) |
12.47 (trailing 12M EPS 42 sen) |
|
Quality of Earnings (past 12 months) (Operating cash flow/net profit) |
1.692 |
1.126 |
|
ROE |
9.22% |
8.510 |
|
Net profit margin (%) |
13.602% |
11.8% |
|
ROIC |
13.45 % |
12.22% |
|
Return On Assets (ROA) |
8.06% |
7.4% |
|
Cash & Equivalents |
3,625mil |
3,564mil |
|
Total borrowings |
0 |
0 |
|
Dividend Paid per share (sen) |
23 |
?? |
|
Free cash flow (FCF) |
329mil |
251mil |
For a more comprehensive evaluation, I have use 10 metrics to evaluate Lctitan. pls refer to the table below for the details of the points scored by Lctitan.
This table I decided not to open to public at this moment.
Prospect and Fair value for FY2018
As the petrochemical industry is cyclical, new investments usually occur at the same time, following periods of sustained higher profitability. Cyclical changes in supply and demand are usually closely linked to economic growth patterns, especially in China given its strong manufacturing base.
Let us have a look on the commentary prospect of the latest Lctitan report as below:

Source: 1Q’18 report
Let see the price of two Lctitan main products (High Density Polyethylene and Polypropylene) as shown in figures below:

Source: https://www.chemorbis.com/en/
 Source: https://www.chemorbis.com/en/price-index/
From the two price charts above, we can observe that prices of HDPE and PP are on uptrend from April to June 2018. Anyway, the price of naphtha also increasing due to crude oil also increasing during this period. I expect the profit margin of Lctitan can be slightly improved in 2Q18 and revenue should improve due to higher selling price and demands of PE and PP products especially general election 14 and Ramadan month fall in 2Q18 period.
According to the recent AGM and annual report of the Group, the TE3's fluidised Naphtha cracker plant started its operation in Dec 2017. The TE3 project in Johor is expected to raise the processing capacity of ethylene and propylene. I expect the TE3 plant to contribute positively to Lctitan's revenue from FY18 onwards. The management in AGM has guided for LCTITAN's production output to be normalised in FY18 on the back of no planned plant shut downs.
The Chinese government by Jan 2018 strengthen and clamped down on the production of petrochemical products to comply with pollution policy laws to improve their air quality. This clamped down ban import of toxic recycled plastic waste to china which may reduce China PP and PE products supply. This has caused some disruption in petrochemical supply as majority Chinese petrochemical factories are required to shut down to upgrade their facilities. In recent AGM, Lctitan management also stated that China’s recent blue sky policy which ban import on recycled plastic waste will affect the market supply, Under this situation, non-China petrochemical company like Lctitan is expected to win market share from petrochemical products in China. (https://www.agchemigroup.eu/en/blog/post/impact-chinas-blue-skies-environmental-policy-chemicals-sector)
(https://www.icis.com/resources/news/2018/04/20/10213862/china-will-totally-ban-import-of-waste-plastic-in-2019/)
Let us have a comparison of capacity utilization rate for FY2016, FY2017 and FY2018
|
|
FY2016 |
FY2017 |
FY2018 (*estimated) |
|
Utilization rate |
91% |
73% (two statutory maintenance activities in Feb & July) |
*87% Demands should pick up due to Ramadan and higher car sales (more synthetic plastic needed) |
|
Capacity |
|
8 plants produce polyolefin products, with combined capacities of
1,015 KTA of polyethylene and 440 KTA of polypropylene. 6 plants produce
olefin have a total capacity of 1,913 KTA. |
The PP3 Project in Johor, which involves the construction of a new
polypropylene plant to create an additional 200 KTA supply of
polypropylene |
Besides, higher car sales (more synthetic plastic like PP needed) will increase the sales of Lictitan’s products in Q2 and Q3 of 2018. This is once a life-time opportunity that should benefit petrochemical industry especially for Lctitan. (refer to http://www.craftechind.com/13-high-performance-plastics-used-in-the-automotive-industry/)
In addition, from the 2017 new TE3 plant upgrade, Lctitan has new 30% additional production capacity in FY18 which can meet higher demands in Malaysia and Indonesia. To date, Lctitan’s PP3 project, currently 91% completed, is expected to start commencing by June 2018 and full commissioning expected in 2H18. Lctitan’s LCUSA plant (40% share JV partnership) in Louisana, USA still work in progress, on schedule to operate by July 2019. In view of the expected improved plant utilization rate in FY18 and possible higher demand in Malaysia and Indonesia, I am projecting a full year EPS of 55 sen - 60 sen for FY2018.
Lctitan historical PEx range from 11 to 12.5 for the past 12 months. Currently Lctitan is a net cash company and zero debt with approximately 3,564mil cash in hand. Strong cash flow and zero debt provide the sustainability of the future dividend yield. Based on projected FY2018 56sen EPS (assume 10% EPS growth from FY2017 EPS even new plants contribute 30% additional capacity), the fair forward 12-month PE for should be in the range of 11x-12x (translated to RM6.16 to RM6.72). PE12x is consider reasonable valuation in petrochemical industry sector where its peer PCHEM currently trading at trailing PE at about 17x.
|
PEx |
Assume 10% growth in 2018 EPS = 20.5 sen |
Upside from RM5.12 |
|
11x fair value |
6.16
|
20%
|
|
12x fair value |
6.72
|
30%
|
SWOT analysis (S-strengths, W-weaknesses, O-opportunities, and T-threats)
|
Strengths |
Weaknesses |
|
|
|
Opportunities |
Threats |
|
|
- Forex loss due to RM weakening in Q2’18
- Rising labour cost (min wages increment in the future)
- Rising crude oil price which may affect naphtha price.
You can get my latest update on share analysis at Telegram Channel ==> https://t.me/davidshare
Disclaimer:
This writing is based on my own assumptions and estimations. It is
strictly for sharing purpose, not a buy or sell call of the company.
If you’re curious what plastics are recycled—and what happens to recycled plastics Below is a table that describe for the most commonly recycled plastics.
Note: resin means a type of plastic. The resin code is typically found on plastic packaging.
|
Resin code |
Name/description |
A few common uses |
Examples of uses for recycled resin |
|
1 PET |
Polyethylene terephthalate is clear, tough, and a good barrier to
moisture. When woven into fabric, it’s known as polyester. |
Polyethylene terephthalate is commonly used for: Beverage bottles;
condiment bottles and jars; frozen food trays; clamshell containers;
mouthwash and other toiletry bottles; clothing; carpeting |
Recycled polyethylene terephthalate is can be turned into: Clothing
such as fleece jackets, T-shirts and leggings; carpeting; vehicle
upholstery; bottles |
|
2 HDPE |
High-density polyethylene is a rigid plastic that resists corrosion when exposed to a variety of substances. |
High-density polyethylene is commonly used for: Milk and juice
jugs; laundry detergent and bleach bottles; shampoo and other toiletry
bottles; vitamin bottles |
Recycled high-density polyethylene can be turned into: Plastic
bottles and jugs; plastic lumber for decks, outdoor furniture, and
playground equipment |
|
3 PVC |
Polyvinyl chloride offers clear, high-impact strength and resistance to corrosion. |
Polyvinyl chloride is commonly used for: Rigid packaging such as
clamshells; rigid film, pipes, siding, flooring, and window frames;
insulation for electrical wire |
Recycled polyvinyl chloride can be turned into: Pipes; floor tiles
and mats; mud flaps for trucks; garden hoses; traffic cones; carpet
backing; hotel key cards; credit cards |
|
4 LDPE |
Low-density polyethylene is a transparent, flexible plastic used extensively in wraps, bags and other films. |
Low-density polyethylene is commonly used for: Bags for groceries,
dry cleaning, bread and trash; wraps to package products such as cases
of water bottles and diapers; cling wrap for food protection; squeezable
condiment bottles; mail-order garment packaging |
Recycled low-density polyethylene can be turned into: Plastic
composite lumber for decks; floor tiles; compost bins and trash cans |
|
5 PP |
Polypropylene is a durable plastic that can stand up to a range of temperatures and substances. |
Polypropylene is commonly used for: Yogurt and margarine containers
and lids; deli containers; beverage bottle caps; clamshells; medicine
jars; condiment bottles; convenience store drink cups; reusable food
storage containers |
Recycled polypropylene can be turned into: Mixing bowls, spatulas
and cutting boards; shovels and watering cans; automotive battery cases,
oil funnels, and ice scrapers; storage bins; shipping pallets |
|
6 PS |
Polystyrene is a versatile plastic that can be made rigid and clear or as an opaque foam. |
Polystyrene is commonly used for: Foodservice clamshell containers,
plates, cups, lids and cutlery; meat and poultry trays; protective
packaging, building insulation |
Recycled polystyrene can be turned into: Insulation; egg cartons;
picture frames, moldings, and other home décor products; foam protective
packaging |
|
7 Other |
This resin either is none of the six above or is made with more than one resin. |
Depends on resin |
Depends on resin |

