OKA (7140): Bullish
Pattern: Cup & Handle Breakout
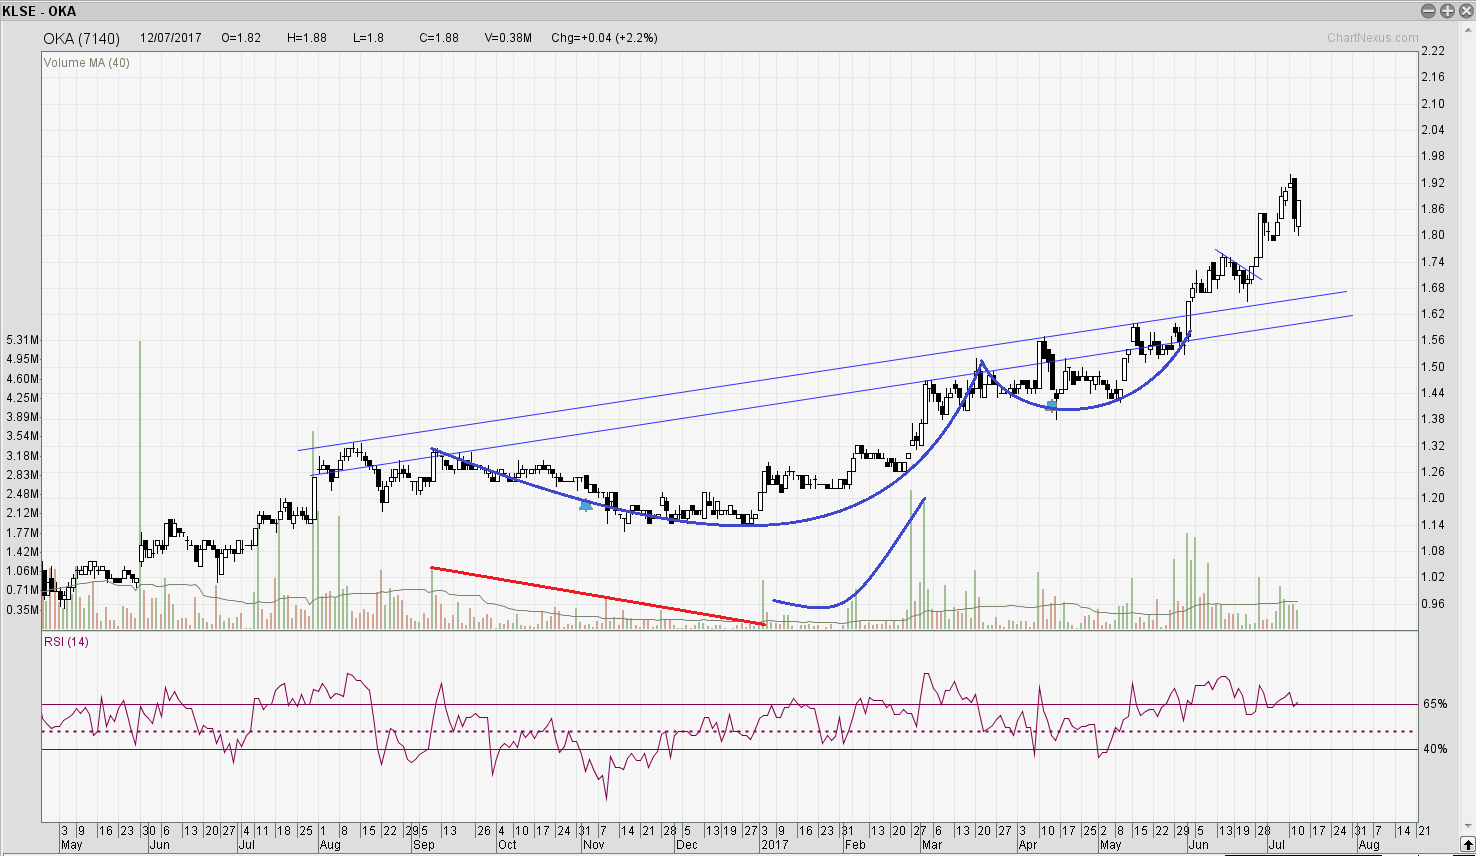
Based on OKA's daily chart above, OKA has broken out from the cup & handle neckline on 1 June 2017 with strong volume and subsequently achieved the first target of 1.91 a few days ago.
During the making of the cup since last year September, it is noted that the volume is shrinking (declining red line) until the bottom is formed. After that, the up move is accompanied by impulsive strong volume, which shows its true intent - bullish.
Based on the price action and the volume flow, OKA is a strong bullish stock with healthy uptrend intact.
The 2nd and 3rd target price of OKA are 2.09 and 2.2.
I am bullish on OKA as long as it is trading above 1.60.
Leave me a comment below and let me know what you think. If you have any queries or want to share the next big stock with me, feel free to contact me via my email or FB page below.
Topics That You Do Not Want To Miss
How to determine the "bullishness" of the patterns - https://www.facebook.com/BursaSGXcandlestick/videos/378260995905662/
The Trade Management Technique You Need To Know - http://klse.i3investor.com/blogs/candlestick/114496.jsp
Best Way To Learn To Trade Without A Mentor - http://klse.i3investor.com/blogs/candlestick/113821.jsp
Come Up With Trading Ideas & Turn Them Into Investing Ideas - http://klse.i3investor.com/blogs/candlestick/114110.jsp
Cheers,
Ming Jong
Get Update From ==> http://www.vipplatform.com/lp/ideas/
FB Page ==> https://www.facebook.com/BursaSGXcandlestick/
Telegram Channel ==> https://t.me/BursaSGXCandlestick
Contact Via Email ==>
http://klse.i3investor.com/blogs/candlestick/127780.jsp
