
If you like to read post Q4 16 Part I article which posted on 7th March 17, you may follow below link:
https://klse.i3investor.com/blogs/frontkn/117763.jsp
Let examine the Q1 2017 result.
On Revenue:
| Semi-con | Engineering | ||||||
| Frontkn | total | total | |||||
| Revenue (mil) | Twn | Sg | My | Phi | Indon | China | |
| 2013Q1 | 13,948 | 29,732 | 18,027 | 7,205 | 3,637 | 300 | 563 |
| 2013Q2 | 16,197 | 27,670 | 15,156 | 8,379 | 3,068 | 384 | 683 |
| 2013Q3 | 17,839 | 33,496 | 21,049 | 8,652 | 2,843 | 358 | 594 |
| 2013Q4 | 17,746 | 40,471 | 25,516 | 9,416 | 4,403 | 697 | 439 |
| Total | 65,730 | 131,369 | 79,748 | 33,652 | 13,951 | 1,739 | 2,279 |
| % from total biz | 33.35% | 66.65% | |||||
| 2014Q1 | 17,915 | 31,791 | 17,046 | 10,753 | 3,017 | 758 | 217 |
| 2014Q2 | 20,350 | 55,589 | 13,796 | 38,841 | 2,693 | 259 | 0 |
| 2014Q3 | 22,807 | 63,028 | 14,490 | 45,731 | 2,807 | 0 | 0 |
| 2014Q4 | 31,195 | 77,777 | 21,666 | 52,650 | 3,028 | 433 | 0 |
| Total | 92,267 | 228,185 | 66,998 | 147,975 | 11,545 | 1,450 | 217 |
| % from total biz | 28.79% | 71.21% | |||||
| 2015Q1 | 23,456 | 55,765 | 13,205 | 37,905 | 3,811 | 844 | N/A |
| 2015Q2 | 25,913 | 42,829 | 13,318 | 25,173 | 3,815 | 523 | |
| 2015Q3 | 29,417 | 41,773 | 14,877 | 22,221 | 3,930 | 745 | |
| 2015Q4 | 30,254 | 38,718 | 12,410 | 21,548 | 4,289 | 471 | |
| Total | 109,040 | 179,085 | 53,810 | 106,847 | 15,845 | 2,583 | 0 |
| % from total biz | 37.84% | 62.16% | |||||
| 2016Q1 | 26,848 | 32,449 | 9,688 | 17,779 | 4,371 | 611 | N/A |
| 2016Q2 | 30,714 | 33,317 | 11,383 | 16,872 | 4,207 | 855 | |
| 2016Q3 | 33,785 | 31,405 | 9,931 | 16,350 | 4,328 | 796 | |
| 2016Q4 | 36,908 | 39,763 | 15,966 | 17,532 | 5,482 | 783 | |
| Total | 128,255 | 136,934 | 46,968 | 68,533 | 18,388 | 3,045 | 0 |
| % from total biz | 48.36% | 51.64% | |||||
| 2017Q1 | 35,444 | 32,097 | 13,689 | 13,444 | 4,796 | 168 | |
| Total | 35,444 | 32,097 | 13,689 | 13,444 | 4,796 | 168 | 0 |
| Semi-con | Engineering |
(1) Oil & Gas Engineering segment - No Suprise, as Usual.
(2) Taiwan Ares Green - Revenue continue to grow in Q1 2017
On Profitability:
| Semi-con | Engineering | |||||||
| Taiwan biz % margin | Operating Profit (mil) | Twn | Sg | My | Phi | Indon | China | |
| 5.64% | 2013Q1 | 787 | 1,547 | 819 | 518 | 516 | -278 | -28 |
| 17.62% | 2013Q2 | 2,854 | -1,814 | -523 | -1,215 | 365 | -175 | -266 |
| 18.95% | 2013Q3 | 3,380 | -364 | 945 | -379 | 348 | -926 | -352 |
| 12.54% | 2013Q4 | 2,226 | 803 | 1,232 | -243 | 646 | -242 | -590 |
| 14.07% | Total | 9,247 | 172 | 2,473 | -1,319 | 1,875 | -1,621 | -1,236 |
| % from total biz | 98.17% | 1.83% | ||||||
| 12.86% | 2014Q1 | 2,303 | 955 | -115 | 795 | 564 | 329 | -618 |
| 17.36% | 2014Q2 | 3,532 | 163 | -1,996 | 2,914 | 377 | -563 | -569 |
| 16.76% | 2014Q3 | 3,823 | 5,227 | 973 | 4,065 | 369 | -3 | -177 |
| 14.09% | 2014Q4 | 4,395 | 5,687 | 2,361 | 4,709 | 317 | -181 | -1,519 |
| 15.23% | Total | 14,053 | 12,032 | 1,223 | 12,483 | 1,627 | -418 | -2,883 |
| % from total biz | 53.87% | 46.13% | ||||||
| 21.50% | 2015Q1 | 5,042 | 5,971 | -434 | 5,571 | 783 | 51 | N/A |
| 22.46% | 2015Q2 | 5,819 | -4,076 | -1,644 | -2,932 | 757 | -257 | |
| 24.03% | 2015Q3 | 7,069 | -4,842 | 1,043 | -6,415 | 690 | -160 | |
| 8.77% | 2015Q4 | 2,652 | 911 | 255 | 229 | 824 | -397 | |
| 18.88% | Total | 20,582 | -2,036 | -780 | -3,547 | 3,054 | -763 | 0 |
| % from total biz | 110.98% | -10.98% | ||||||
| 10.16% | 2016Q1 | 2,727 | -672 | -4,192 | 2,934 | 731 | -145 | N/A |
| 21.55% | 2016Q2 | 6,620 | 1,913 | -881 | 1,972 | 821 | 1 | |
| 24.75% | 2016Q3 | 8,363 | 803 | -1,265 | 1,213 | 796 | 59 | |
| 16.85% | 2016Q4 | 6,220 | 7,137 | 5,202 | 1,080 | 862 | -7 | |
| 18.66% | Total | 23,930 | 9,181 | -1,136 | 7,199 | 3,210 | -92 | 0 |
| % from total biz | 72.27% | 27.73% | ||||||
| 20.21% | 2017Q1 | 7,164 | 2,162 | 221 | 1,530 | 889 | -478 | N/A |
| #DIV/0! | 2017Q2 | 0 | ||||||
| #DIV/0! | 2017Q3 | 0 | ||||||
| #DIV/0! | 2017Q4 | 0 | ||||||
| 20.21% | Total | 7,164 | 2,162 | 221 | 1,530 | 889 | -478 | 0 |
| % from total biz | 76.82% | 23.18% |
Key Observation:
(1) Oil and gas segment - Looks stable
(2) Taiwan Ares Green - Doing Fantastic!!!
(3) Projection - Oil and gas should remain stagnant, the growth continue to come from Taiwan Ares Green.
On Balance Sheet:
(1) cash level raised from 94 mil in Q4 16 to 108 million in Q1 2017. Or equivalent to RM 0.10 per share. Adding back this sum, share price should worth RM 0.39
On valuation:
current PE stood at 11.56. Reasonable to me.
Technical Wise:
I use Sifu OTB chart:
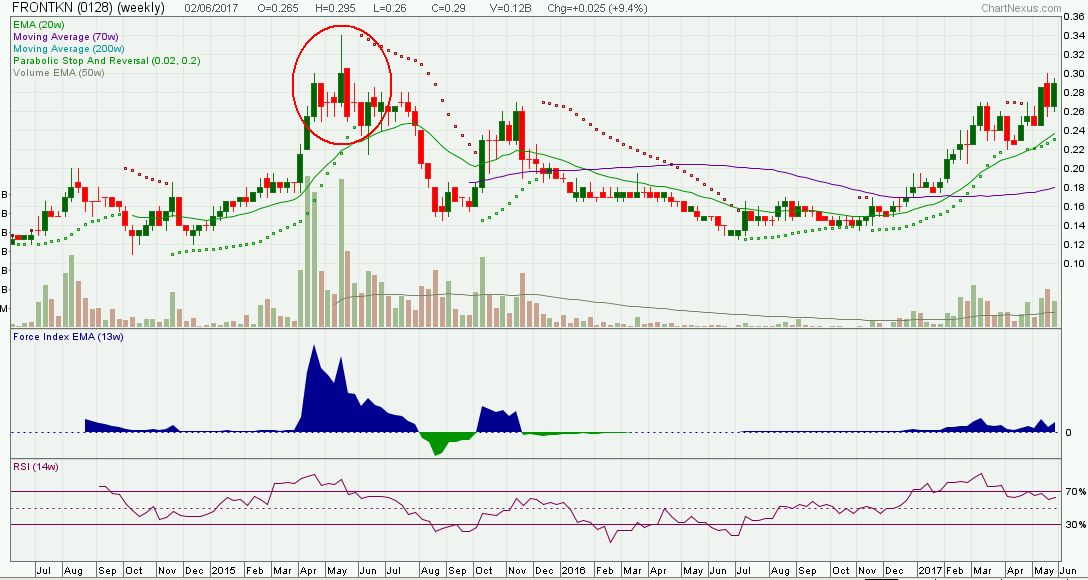
Key observation:
(1) Looking forward to break historical intraday high of RM 0.34 on 18 May 2015.
(2) Frontken used 2 years of time for Ares Green to grow.
http://Frontkn - Buying Time for Growth (4)- YiStock
(3) Is there a Cup & Handle??
Conclusion:
I will continue to hold and probably add some if price retrace a bit.
Cheers,
YiStock
投资股票除了守, 还是守。 好的公司要时间。
http://klse.i3investor.com/blogs/frontkn/124573.jsp
