ZELAN (2283) - ZELAN—Diamond In The Rough
Author: thebodhisattvatrader | Publish date: Mon, 20 Apr 2015, 03:45 AM
3-YEAR HEAD & SHOULDERS BOTTOM
Signal Type: Major Reversal
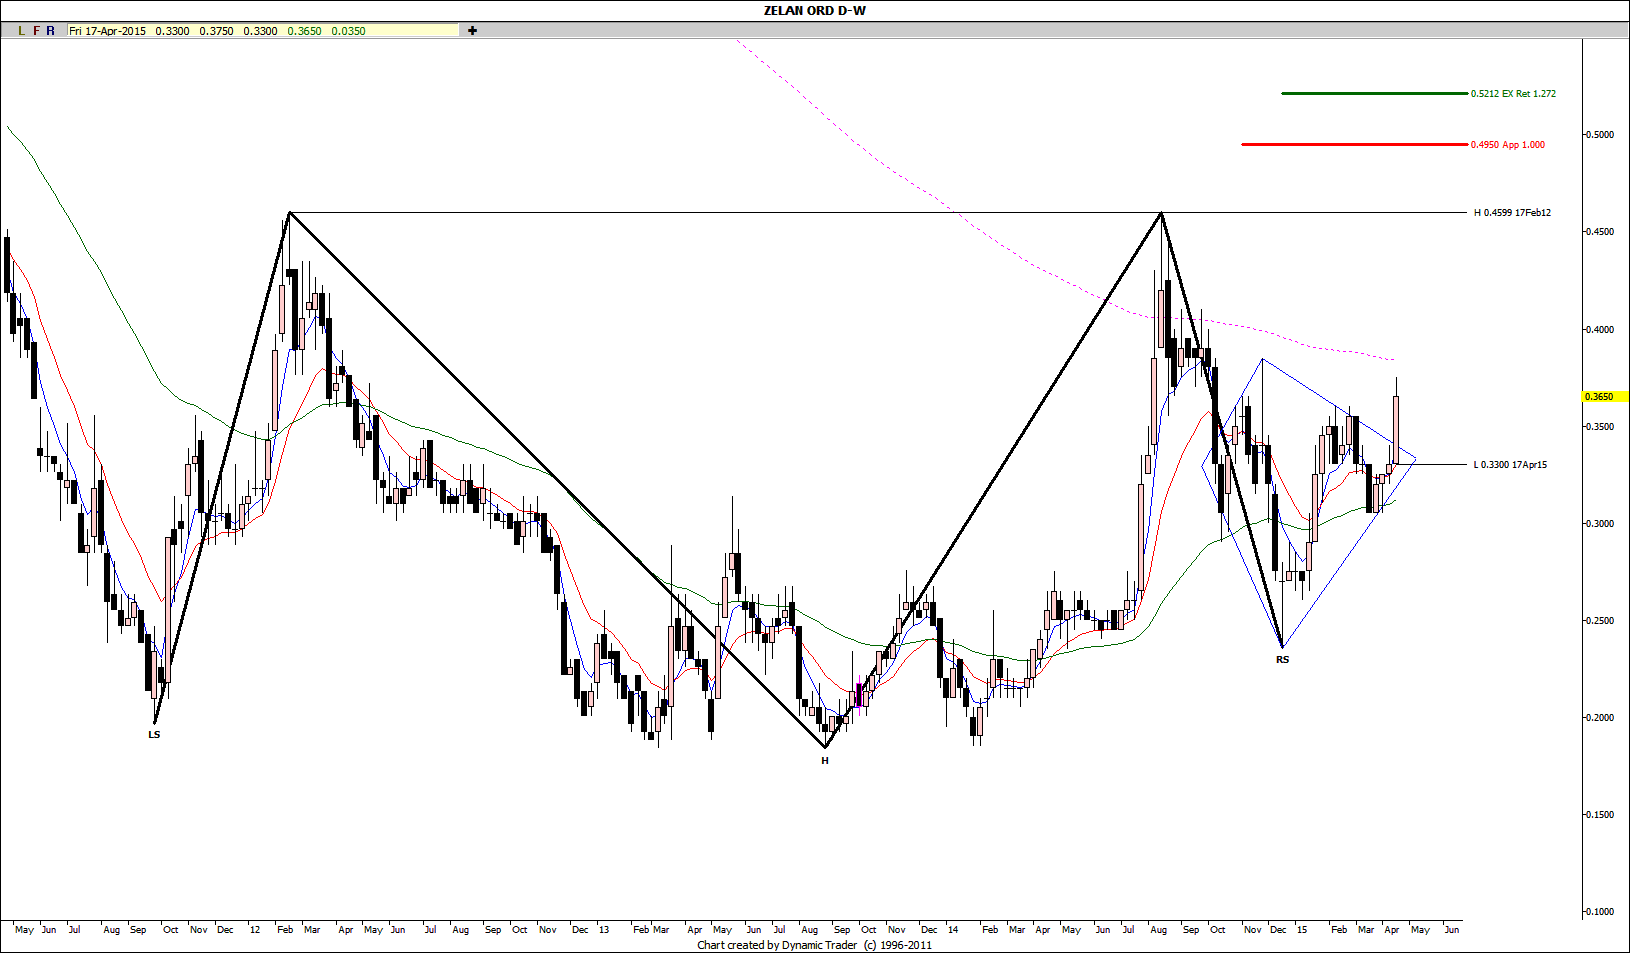
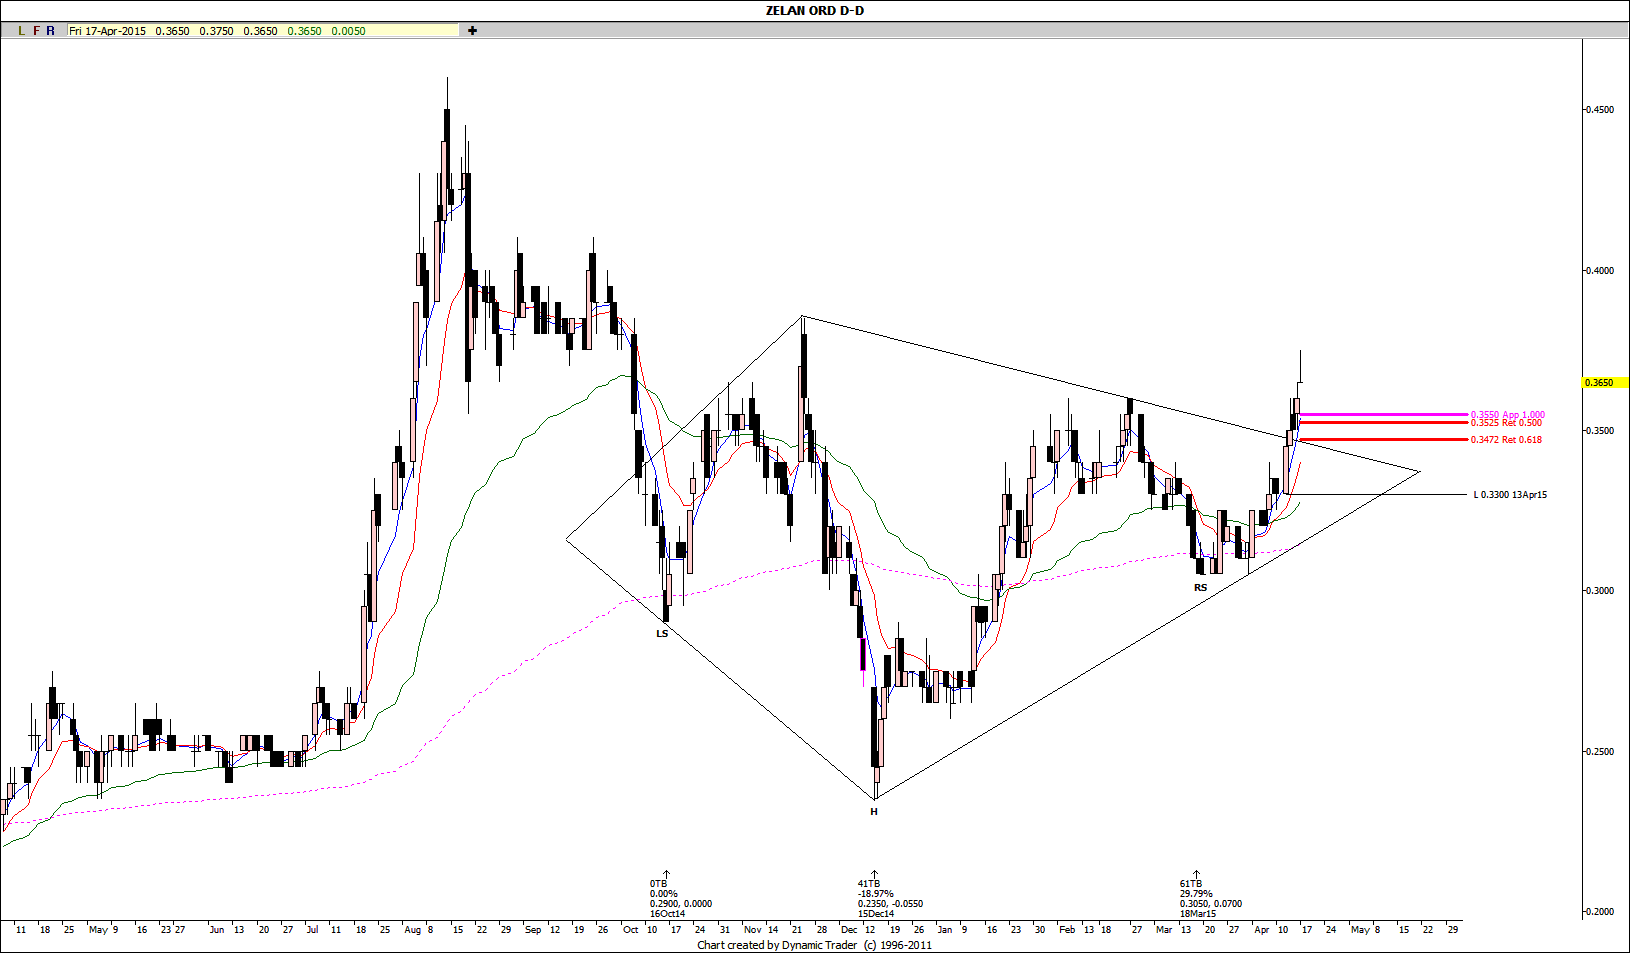
Last week’s breakout printed a wide-range trading bar, otherwise defined as a Wide Bodied Bar (WBB), coupled with the highest volume recorded since November ’14 (not shown), signals the pattern completion of a 25-week Diamond Bottom in the weekly chart.
Using this strong weekly bar as a key reference based on the Breakout Rule, a stop loss has been placed at 0.325. However, the violation of this stop loss level merely negates the Weekly Diamond Bottom hypothesis.
The POSSIBLE outcome to be twofold:

The Diamond Bottom pattern has a measured target of 0.50; However, Friday’s price action was not a pretty one ending the week with a Doji-Gravestone.
I was hoping for a strong bar to further strengthen the breakout. I am
expecting a pattern retest next week to perhaps the 0.34 to 0.35 on low
volume. I will use this opportunity to accumulate should this retest
holds.

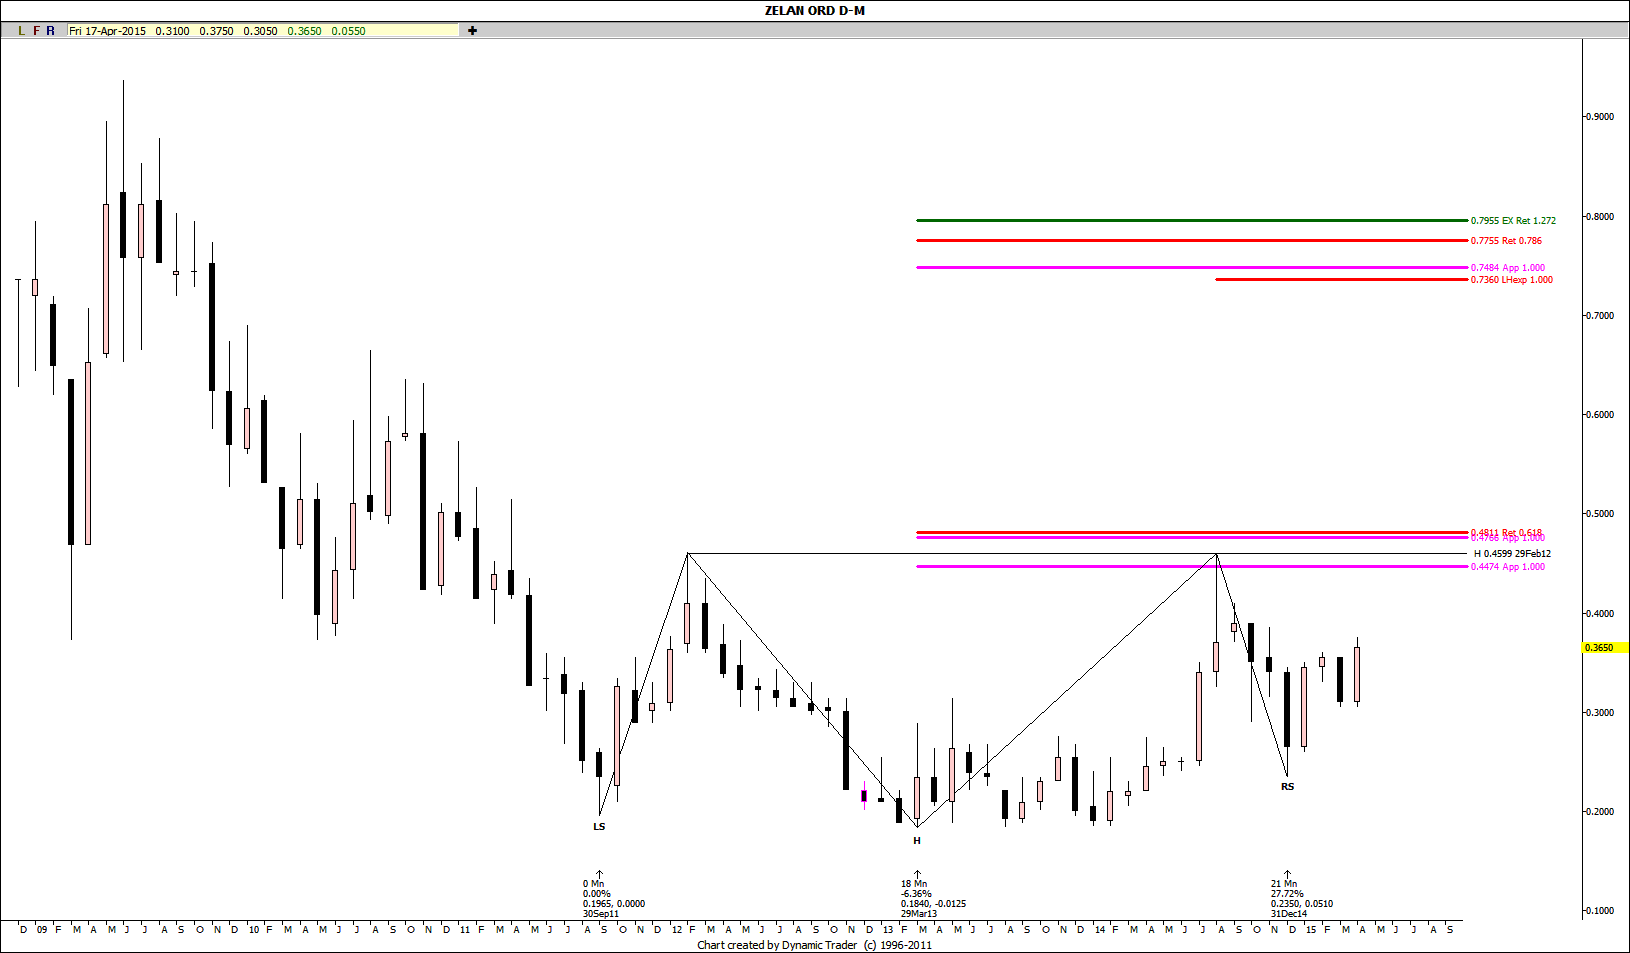
Supports the higher degree timeframe hypothesis that Zelan is carving out a massive 3-Year Head & Shoulders Bottom. This
ultra long-term trade was probably triggered back in December ‘14 and
again in January ‘15 after the January high range breakout. There is
lovely symmetry between the two shoulders and the head. I also love the
virtually horizontal neckline of this Head & Shoulders Bottom pattern.
However, I have been hesitating to establish longs simply because the
bearish symmetry since August '14 has been intact. The possible
completion of the weekly Diamond Bottom is an early indication that the bearish symmetry has been broken.

The entire Diamond Bottom pattern
has been supported by the 200-day moving average since October '14. An
alternate possibility would be the not so favored Weekly Head & Shoulders Bottom hypothesis but
I am not a fan of downward sloping necklines and the time symmetry of
the 2 shoulders are slightly off. Which pattern will play off is
somewhat irrelevant as long as 0.33 remains intact.
I
am prepared to hold on to this stock for several months to see how this
pattern plays out. Target is the 0.75 to 0.80 level. With the global
markets currently trading at major extensions and exhibiting solid
bearish chart formations, I will be cautiously holding to this trade.
http://klse.i3investor.com
http://klse.i3investor.com
